ScatterChart
A scatter chart control.
ScatterChart draws some points in a square space,
points are defined by ScatterChartSpots.
fch.ScatterChart(
    aspect_ratio=1.0,
    spots=[
        fch.ScatterChartSpot(
            x=random.uniform(4, 50),
            y=random.uniform(4, 50),
        )
        for _ in range(30)
    ],
)
Inherits: LayoutControl
Properties
animation- Controls chart implicit animation.baseline_x- The baseline value for X axis.baseline_y- Baseline value for Y axis.bgcolor- The chart's background color.border- The border around the chart.bottom_axis- Configures the appearance of the bottom axis, its title and labels.horizontal_grid_lines- Controls drawing of chart's horizontal lines.interactive- Enables automatic tooltips when hovering chart bars.left_axis- Configures the appearance of the left axis, its title and labels.long_press_duration- The duration of a long press on the chart.max_x- The maximum displayed value for X axis.max_y- The maximum displayed value for Y axis.min_x- The minimum displayed value for X axis.min_y- The minimum displayed value for Y axis.right_axis- Configures the appearance of the right axis, its title and labels.rotation_quarter_turns- Number of quarter turns (90-degree increments) to rotate the chart.show_tooltips_for_selected_spots_only- Whether to permanently and only show the tooltips of spots with theirselectedproperty set toTrue.spots- List ofScatterChartSpots to show on the chart.tooltip- The tooltip configuration for the chart.top_axis- Configures the appearance of the top axis, its title and labels.vertical_grid_lines- Controls drawing of chart's vertical lines.
Events
on_event- Called when an event occurs on this chart.
Examples
Scatter chart
import random
import flet as ft
import flet_charts as fch
class MySpot(fch.ScatterChartSpot):
def __init__(
self,
x: float,
y: float,
radius: float = 8.0,
color: ft.Colors = None,
show_tooltip: bool = False,
):
super().__init__(
x=x,
y=y,
radius=radius,
color=color,
show_tooltip=show_tooltip,
selected=y == 43,
)
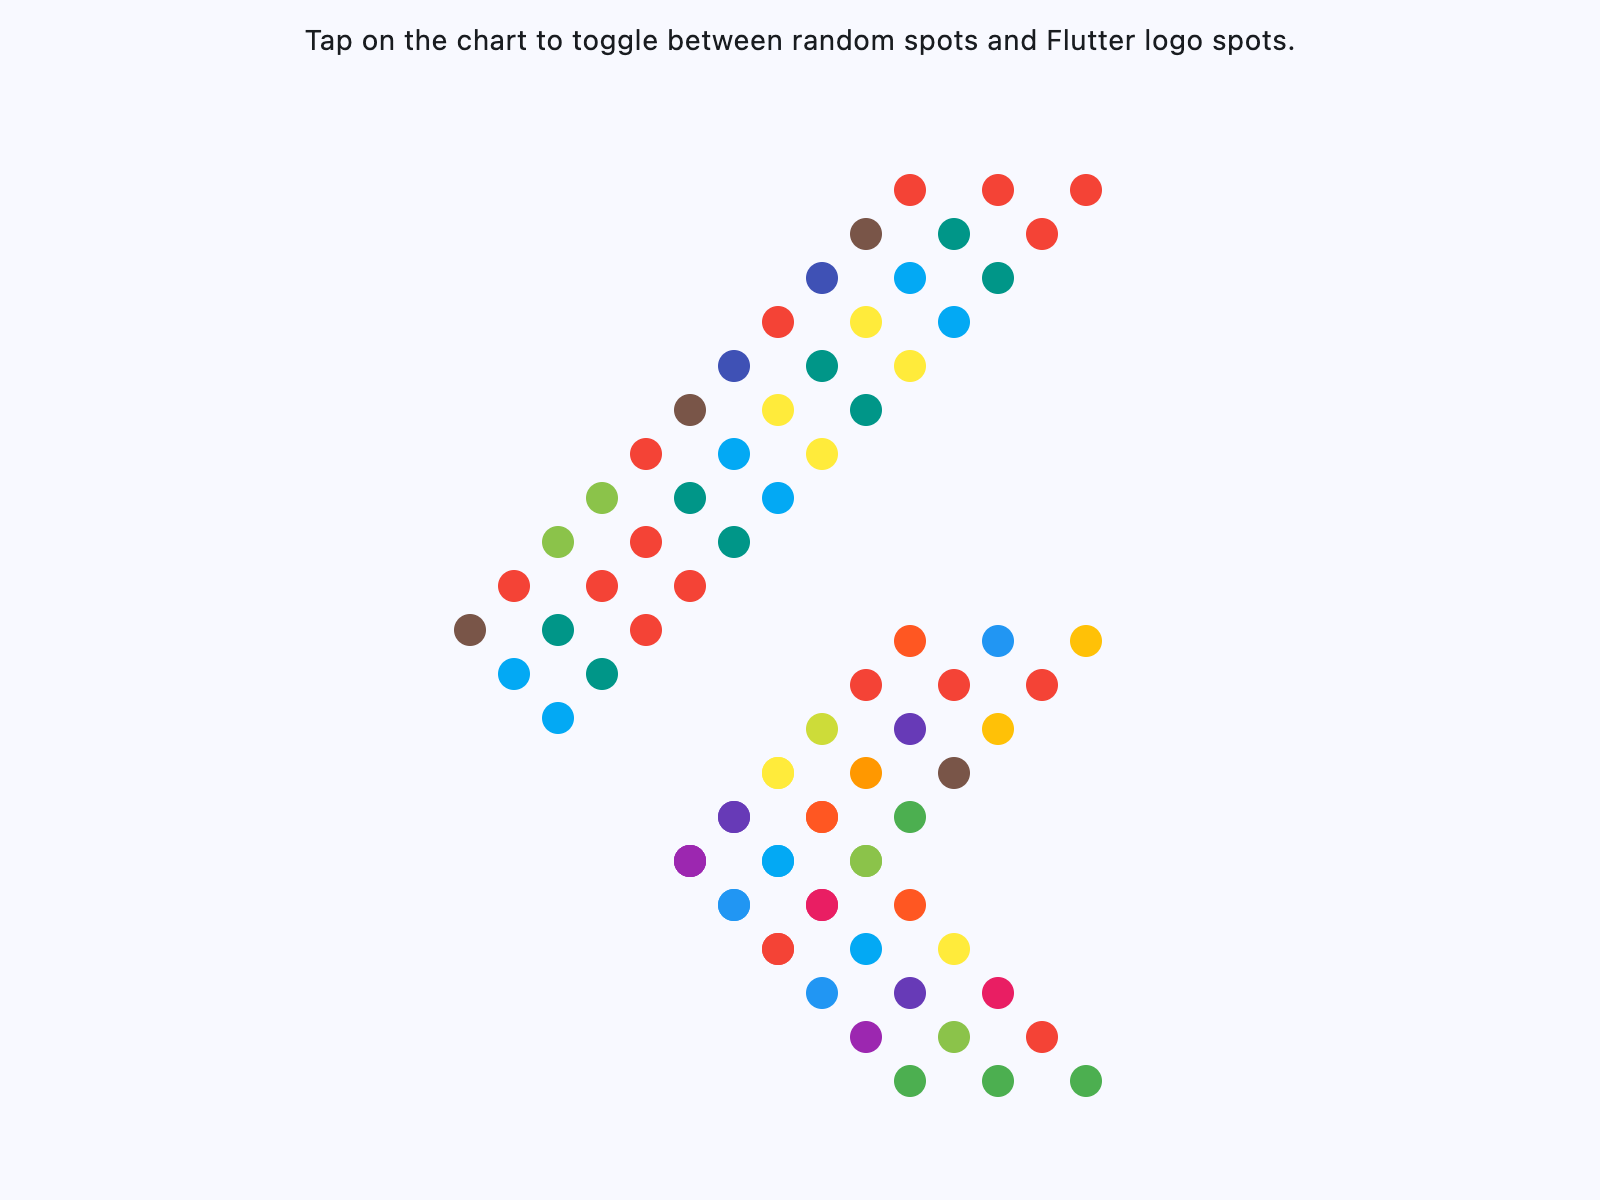
flutter_logo_spots = [
MySpot(20, 14.5),
MySpot(20, 14.5),
MySpot(22, 16.5),
MySpot(24, 18.5),
MySpot(22, 12.5),
MySpot(24, 14.5),
MySpot(26, 16.5),
MySpot(24, 10.5),
MySpot(26, 12.5),
MySpot(28, 14.5),
MySpot(26, 8.5),
MySpot(28, 10.5),
MySpot(30, 12.5),
MySpot(28, 6.5),
MySpot(30, 8.5),
MySpot(32, 10.5),
MySpot(30, 4.5),
MySpot(32, 6.5),
MySpot(34, 8.5),
MySpot(34, 4.5),
MySpot(36, 6.5),
MySpot(38, 4.5),
# section 2
MySpot(20, 14.5),
MySpot(22, 12.5),
MySpot(24, 10.5),
MySpot(22, 16.5),
MySpot(24, 14.5),
MySpot(26, 12.5),
MySpot(24, 18.5),
MySpot(26, 16.5),
MySpot(28, 14.5),
MySpot(26, 20.5),
MySpot(28, 18.5),
MySpot(30, 16.5),
MySpot(28, 22.5),
MySpot(30, 20.5),
MySpot(32, 18.5),
MySpot(30, 24.5),
MySpot(32, 22.5),
MySpot(34, 20.5),
MySpot(34, 24.5),
MySpot(36, 22.5),
MySpot(38, 24.5),
# section 3
MySpot(10, 25),
MySpot(12, 23),
MySpot(14, 21),
MySpot(12, 27),
MySpot(14, 25),
MySpot(16, 23),
MySpot(14, 29),
MySpot(16, 27),
MySpot(18, 25),
MySpot(16, 31),
MySpot(18, 29),
MySpot(20, 27),
MySpot(18, 33),
MySpot(20, 31),
MySpot(22, 29),
MySpot(20, 35),
MySpot(22, 33),
MySpot(24, 31),
MySpot(22, 37),
MySpot(24, 35),
MySpot(26, 33),
MySpot(24, 39),
MySpot(26, 37),
MySpot(28, 35),
MySpot(26, 41),
MySpot(28, 39),
MySpot(30, 37),
MySpot(28, 43),
MySpot(30, 41),
MySpot(32, 39),
MySpot(30, 45),
MySpot(32, 43),
MySpot(34, 41),
MySpot(34, 45),
MySpot(36, 43),
MySpot(38, 45),
]
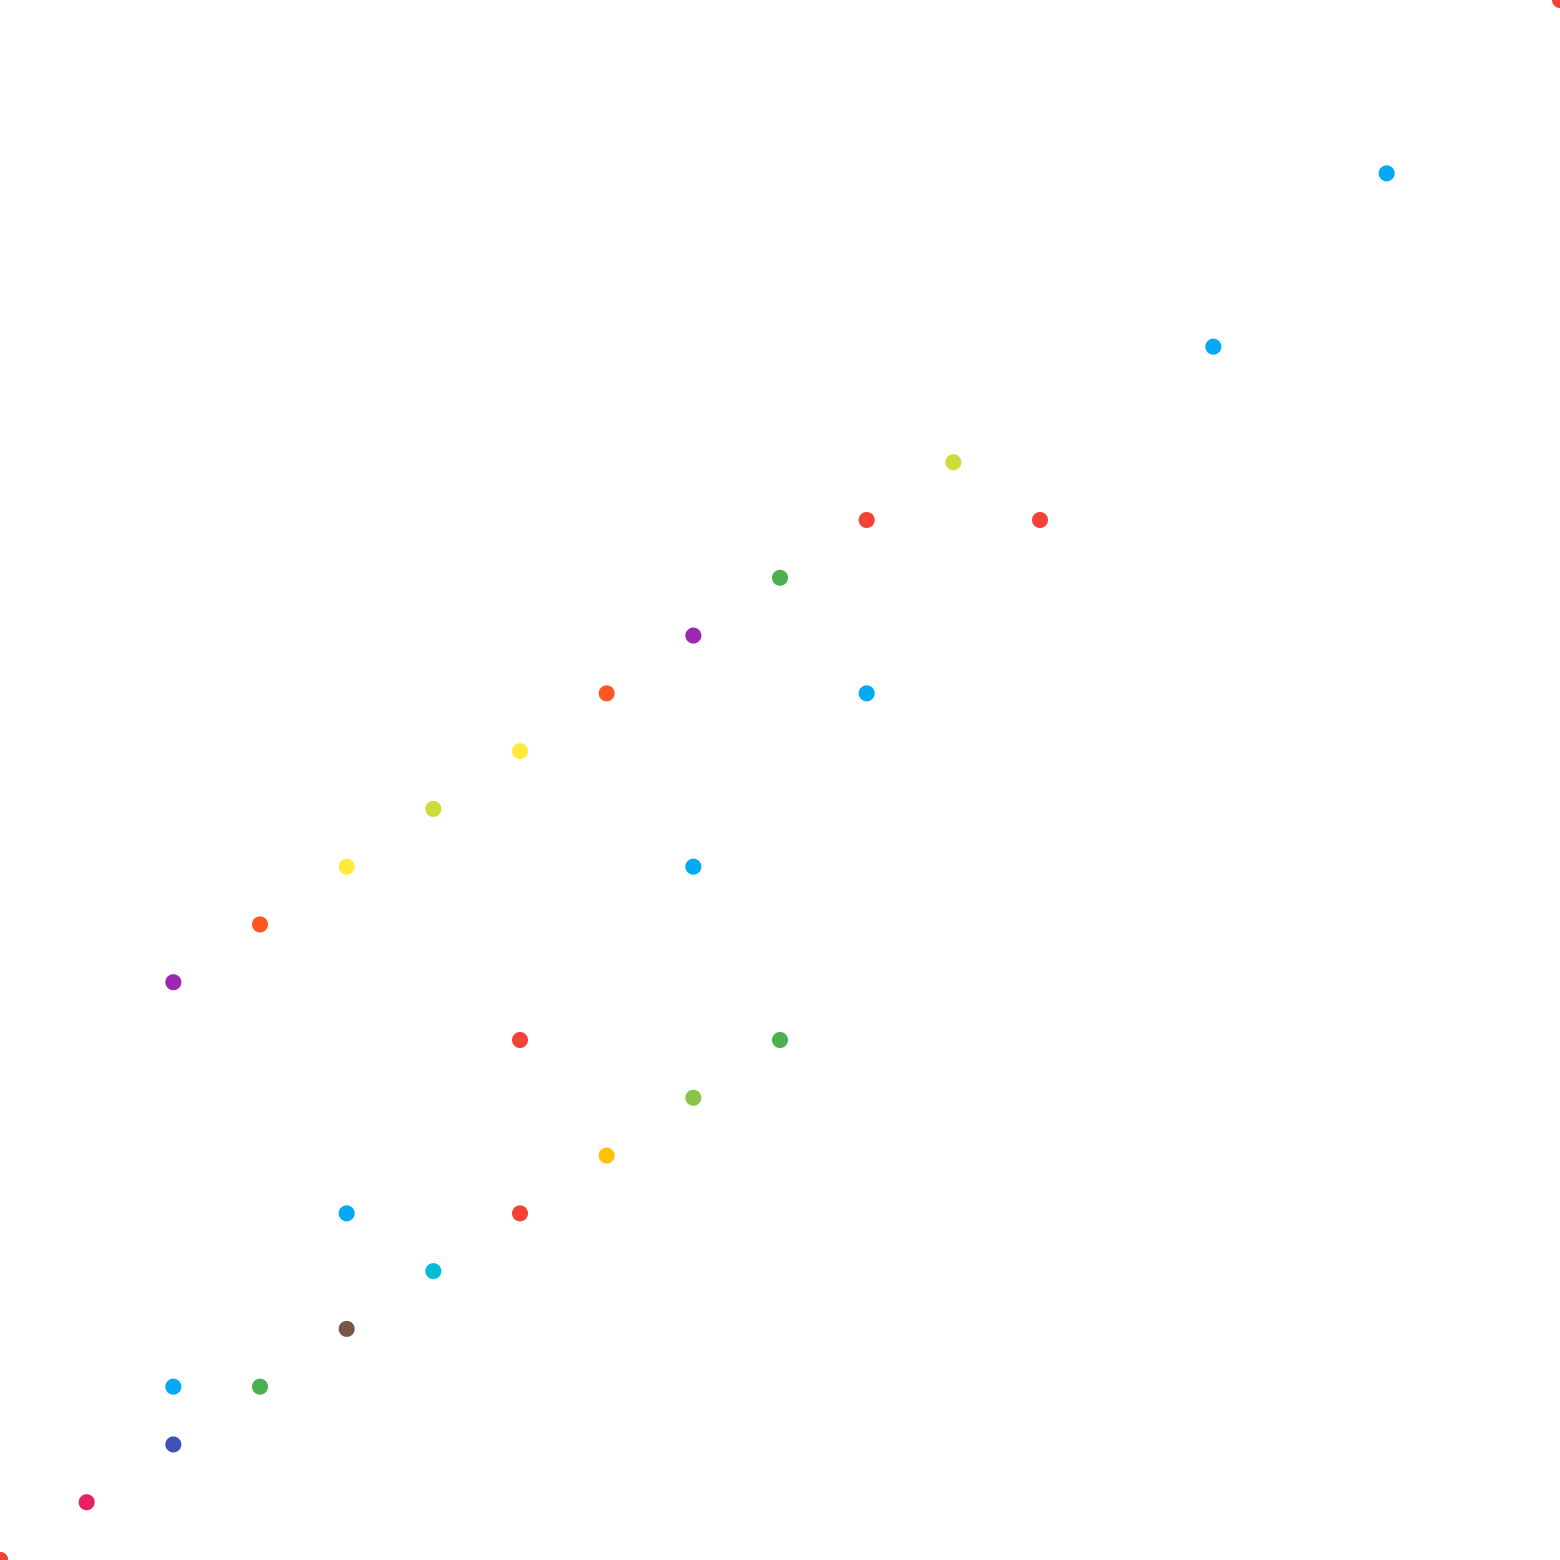
def get_random_spots():
"""Generates random spots for the scatter chart."""
return [
MySpot(
x=random.uniform(4, 50),
y=random.uniform(4, 50),
radius=random.uniform(4, 20),
)
for _ in range(len(flutter_logo_spots))
]
def main(page: ft.Page):
page.horizontal_alignment = ft.CrossAxisAlignment.CENTER
def handle_event(e: fch.ScatterChartEvent):
if e.type == fch.ChartEventType.TAP_DOWN:
e.control.spots = (
flutter_logo_spots
if (e.control.spots != flutter_logo_spots)
else get_random_spots()
)
page.add(
ft.SafeArea(
expand=True,
content=ft.Column(
expand=True,
controls=[
ft.Text(
"Tap on the chart to toggle between random spots and Flutter "
"logo spots."
),
fch.ScatterChart(
expand=True,
aspect_ratio=1.0,
min_x=0.0,
max_x=50.0,
min_y=0.0,
max_y=50.0,
left_axis=fch.ChartAxis(show_labels=False),
right_axis=fch.ChartAxis(show_labels=False),
top_axis=fch.ChartAxis(show_labels=False),
bottom_axis=fch.ChartAxis(show_labels=False),
show_tooltips_for_selected_spots_only=False,
on_event=handle_event,
animation=ft.Animation(
duration=ft.Duration(milliseconds=600),
curve=ft.AnimationCurve.FAST_OUT_SLOWIN,
),
spots=flutter_logo_spots,
),
],
),
),
)
if __name__ == "__main__":
ft.run(main)
Properties
animationclass-attributeinstance-attribute
animation: AnimationValue = field(
    default_factory=lambda: Animation(
        duration=Duration(milliseconds=150),
        curve=AnimationCurve.LINEAR,
    )
)
Controls chart implicit animation.
baseline_xclass-attributeinstance-attribute
baseline_x: Number | None = NoneThe baseline value for X axis.
baseline_yclass-attributeinstance-attribute
baseline_y: Number | None = NoneBaseline value for Y axis.
bgcolorclass-attributeinstance-attribute
bgcolor: ColorValue | None = NoneThe chart's background color.
bottom_axisclass-attributeinstance-attribute
bottom_axis: ChartAxis | None = NoneConfigures the appearance of the bottom axis, its title and labels.
horizontal_grid_linesclass-attributeinstance-attribute
horizontal_grid_lines: ChartGridLines | None = NoneControls drawing of chart's horizontal lines.
interactiveclass-attributeinstance-attribute
interactive: bool = TrueEnables automatic tooltips when hovering chart bars.
left_axisclass-attributeinstance-attribute
left_axis: ChartAxis | None = NoneConfigures the appearance of the left axis, its title and labels.
long_press_durationclass-attributeinstance-attribute
long_press_duration: DurationValue | None = NoneThe duration of a long press on the chart.
max_xclass-attributeinstance-attribute
max_x: Number | None = NoneThe maximum displayed value for X axis.
max_yclass-attributeinstance-attribute
max_y: Number | None = NoneThe maximum displayed value for Y axis.
min_xclass-attributeinstance-attribute
min_x: Number | None = NoneThe minimum displayed value for X axis.
min_yclass-attributeinstance-attribute
min_y: Number | None = NoneThe minimum displayed value for Y axis.
right_axisclass-attributeinstance-attribute
right_axis: ChartAxis | None = NoneConfigures the appearance of the right axis, its title and labels.
rotation_quarter_turnsclass-attributeinstance-attribute
rotation_quarter_turns: Number = 0Number of quarter turns (90-degree increments) to rotate the chart.
Ex: 1 rotates the chart 90 degrees clockwise,
2 rotates 180 degrees and 0 for no rotation.
show_tooltips_for_selected_spots_onlyclass-attributeinstance-attribute
show_tooltips_for_selected_spots_only: bool = FalseWhether to permanently and only show the tooltips of spots with their
selected property set to True.
spotsclass-attributeinstance-attribute
spots: list[ScatterChartSpot] = field(default_factory=list)List of ScatterChartSpots to show on the chart.
tooltipclass-attributeinstance-attribute
tooltip: ScatterChartTooltip = field(
    default_factory=lambda: ScatterChartTooltip()
)
The tooltip configuration for the chart.
top_axisclass-attributeinstance-attribute
top_axis: ChartAxis | None = NoneConfigures the appearance of the top axis, its title and labels.
vertical_grid_linesclass-attributeinstance-attribute
vertical_grid_lines: ChartGridLines | None = NoneControls drawing of chart's vertical lines.
Events
on_eventclass-attributeinstance-attribute
on_event: EventHandler[ScatterChartEvent] | None = NoneCalled when an event occurs on this chart.