BarChart
Draws a bar chart.
fch.BarChart(
    border=ft.Border.all(1, ft.Colors.GREY_400),
    groups=[
        fch.BarChartGroup(
            x=0,
            rods=[
                fch.BarChartRod(
                    from_y=0,
                    to_y=40,
                    color=ft.Colors.BLUE_GREY_200,
                ),
            ],
        ),
        ...,
    ],
)

Inherits: LayoutControl
Properties
animation- Controls chart implicit animation.baseline_y- Baseline value for Y axis.bgcolor- Background color of the chart.border- The border around the chart.bottom_axis- The appearance of the bottom axis, its title and labels.group_alignment- The alignment of the bargroupswithin this chart.group_spacing- An amount of space between bargroups.groups- The list ofBarChartGroups to draw.horizontal_grid_lines- Controls drawing of chart's horizontal lines.interactive- Enables automatic tooltips when hovering chart bars.left_axis- The appearance of the left axis, its title and labels.max_y- The maximum displayed value for Y axis.min_y- The minimum displayed value for Y axis.right_axis- The appearance of the right axis, its title and labels.tooltip- The tooltip configuration for this chart.top_axis- The appearance of the top axis, its title and labels.vertical_grid_lines- Controls drawing of chart's vertical lines.
Events
on_event- Called when an event occurs on this chart, such as a click or hover.
Examples
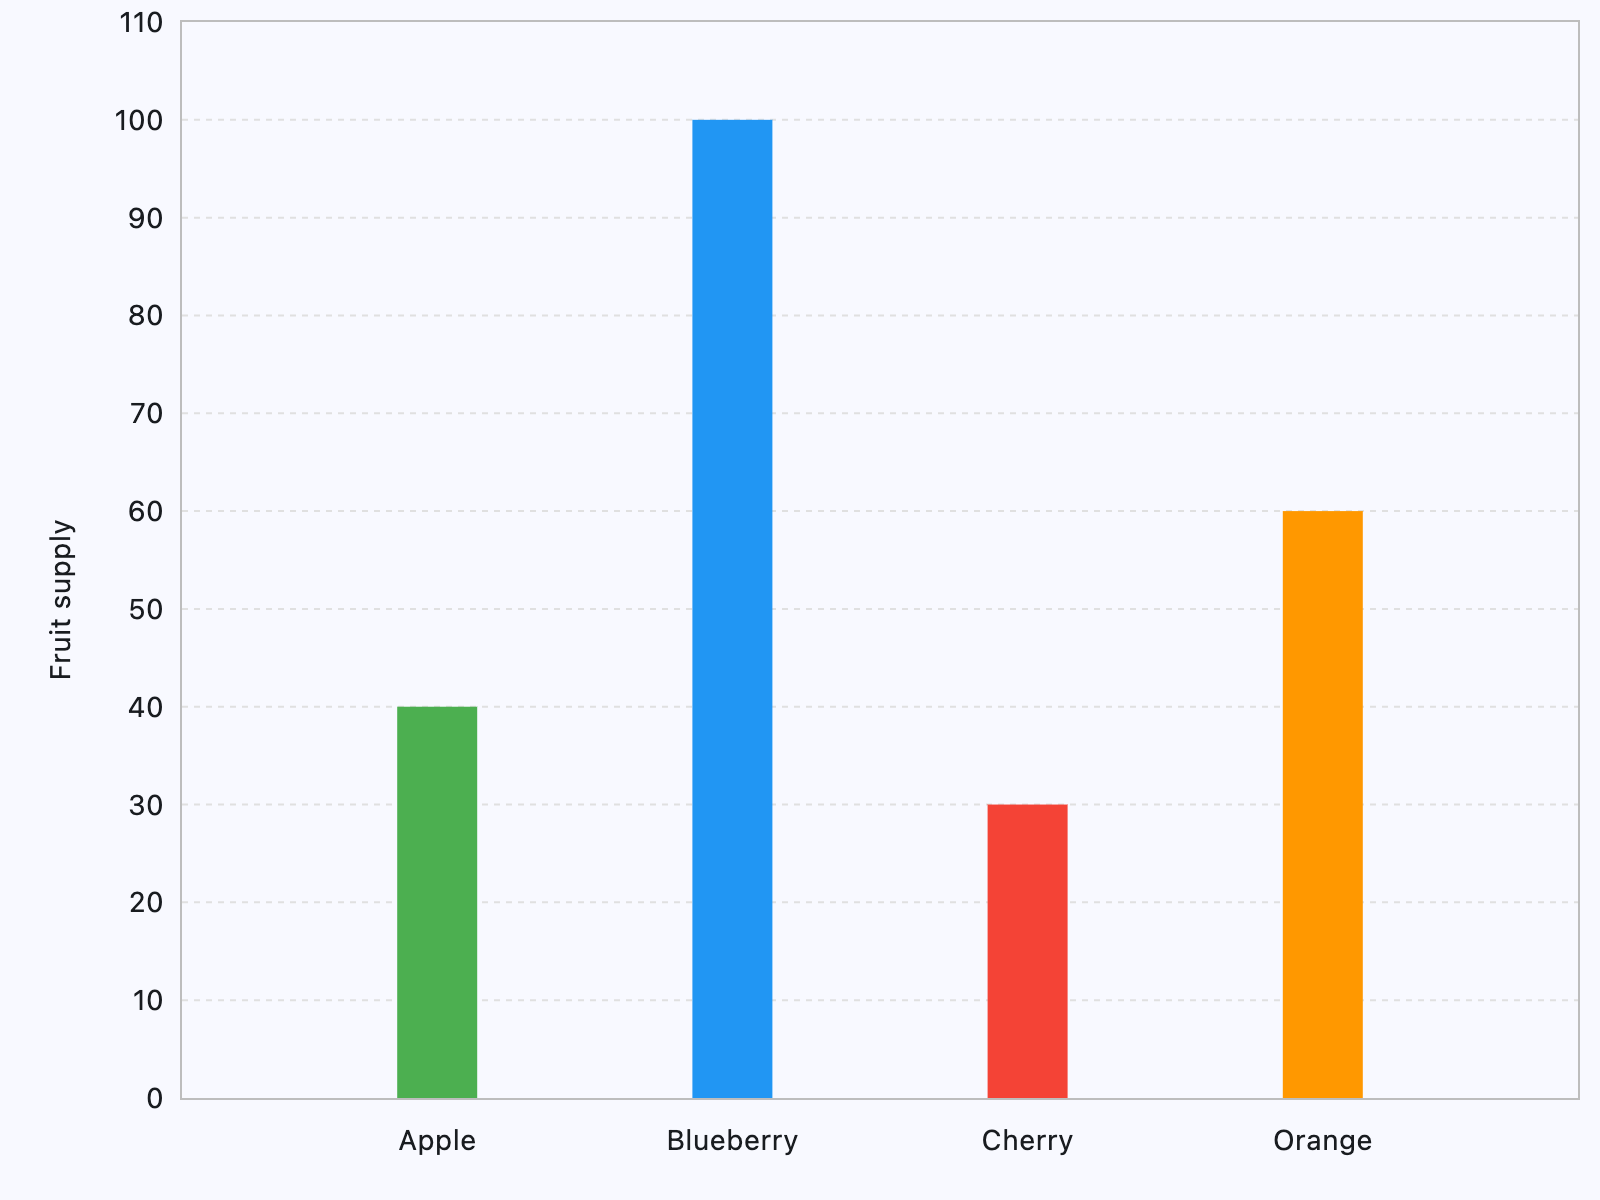
Interactive bar chart
import flet as ft
import flet_charts as fch


def main(page: ft.Page):
    page.add(
        ft.SafeArea(
            expand=True,
            content=fch.BarChart(
                expand=True,
                interactive=True,
                max_y=110,
                border=ft.Border.all(1, ft.Colors.GREY_400),
                horizontal_grid_lines=fch.ChartGridLines(
                    color=ft.Colors.GREY_300, width=1, dash_pattern=[3, 3]
                ),
                tooltip=fch.BarChartTooltip(
                    bgcolor=ft.Colors.with_opacity(0.5, ft.Colors.GREY_300),
                    border_radius=ft.BorderRadius.all(20),
                ),
                left_axis=fch.ChartAxis(
                    label_size=40, title=ft.Text("Fruit supply"), title_size=40
                ),
                right_axis=fch.ChartAxis(show_labels=False),
                bottom_axis=fch.ChartAxis(
                    label_size=40,
                    labels=[
                        fch.ChartAxisLabel(
                            value=0, label=ft.Container(ft.Text("Apple"), padding=10)
                        ),
                        fch.ChartAxisLabel(
                            value=1,
                            label=ft.Container(ft.Text("Blueberry"), padding=10),
                        ),
                        fch.ChartAxisLabel(
                            value=2, label=ft.Container(ft.Text("Cherry"), padding=10)
                        ),
                        fch.ChartAxisLabel(
                            value=3, label=ft.Container(ft.Text("Orange"), padding=10)
                        ),
                    ],
                ),
                groups=[
                    fch.BarChartGroup(
                        x=0,
                        rods=[
                            fch.BarChartRod(
                                from_y=0,
                                to_y=40,
                                width=40,
                                color=ft.Colors.GREEN,
                                border_radius=0,
                            ),
                        ],
                    ),
                    fch.BarChartGroup(
                        x=1,
                        rods=[
                            fch.BarChartRod(
                                from_y=0,
                                to_y=100,
                                width=40,
                                color=ft.Colors.BLUE,
                                tooltip=fch.BarChartRodTooltip("Blueberry"),
                                border_radius=0,
                            ),
                        ],
                    ),
                    fch.BarChartGroup(
                        x=2,
                        rods=[
                            fch.BarChartRod(
                                from_y=0,
                                to_y=30,
                                width=40,
                                color=ft.Colors.RED,
                                border_radius=0,
                            ),
                        ],
                    ),
                    fch.BarChartGroup(
                        x=3,
                        rods=[
                            fch.BarChartRod(
                                from_y=0,
                                to_y=60,
                                width=40,
                                color=ft.Colors.ORANGE,
                                tooltip=fch.BarChartRodTooltip("Orange"),
                                border_radius=0,
                            ),
                        ],
                    ),
                ],
            ),
        )
    )


if __name__ == "__main__":
    ft.run(main)
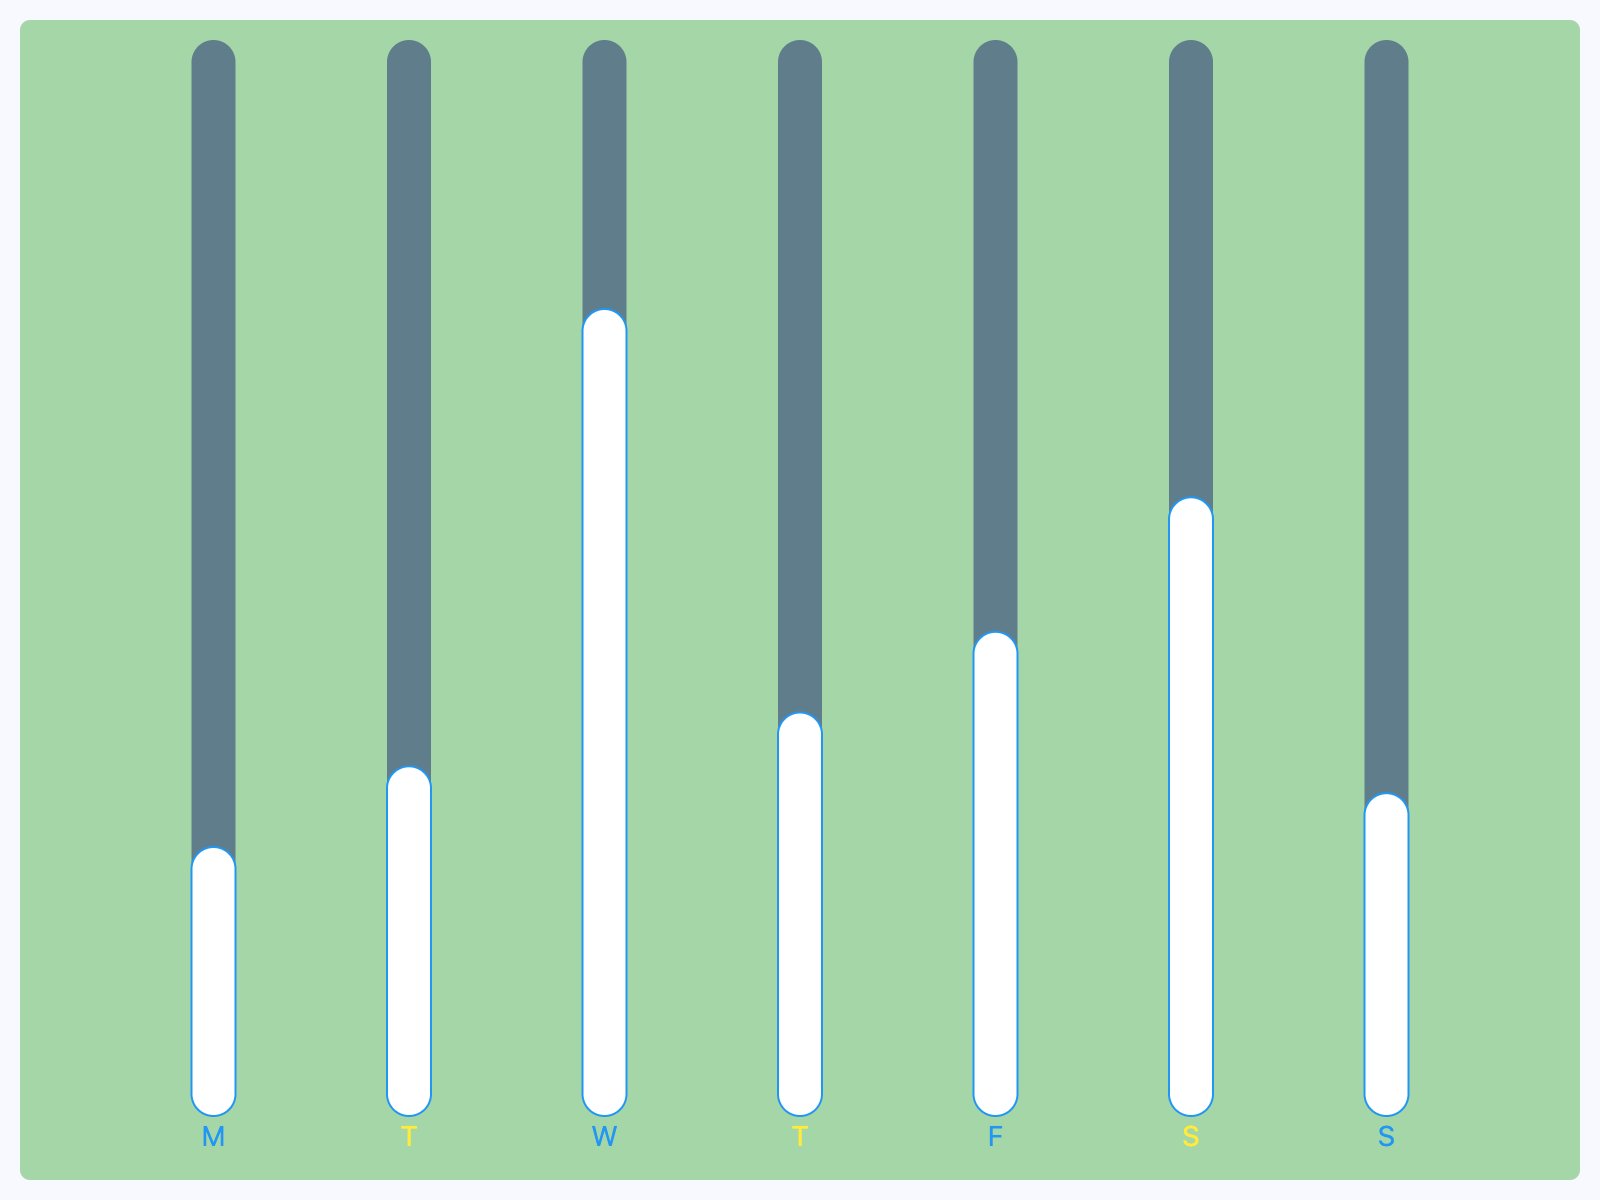
Bar chart with hover
import flet as ft
import flet_charts as fch


class CustomRod(fch.BarChartRod):
    def __init__(self, y: float, hovered: bool = False):
        super().__init__()
        self.hovered = hovered
        self.y = y
        self.width = 22
        self.color = ft.Colors.WHITE
        self.bg_to_y = 20
        self.bg_color = ft.Colors.GREEN_300

    def before_update(self):
        super().before_update()
        self.to_y = self.y + 0.5 if self.hovered else self.y
        self.color = ft.Colors.YELLOW if self.hovered else ft.Colors.WHITE
        self.border_side = (
            ft.BorderSide(width=1, color=ft.Colors.RED)
            if self.hovered
            else ft.BorderSide(width=1, color=ft.Colors.BLUE)
        )


def main(page: ft.Page):
    def on_chart_event(e: fch.BarChartEvent):
        if e.type == fch.ChartEventType.POINTER_HOVER:
            for group_index, group in enumerate(chart.groups):
                for rod_index, rod in enumerate(group.rods):
                    rod.hovered = (
                        e.group_index == group_index and e.rod_index == rod_index
                    )
            chart.update()

    chart = fch.BarChart(
        on_event=on_chart_event,
        interactive=True,
        groups=[
            fch.BarChartGroup(x=0, rods=[CustomRod(5)]),
            fch.BarChartGroup(x=1, rods=[CustomRod(6.5)]),
            fch.BarChartGroup(x=2, rods=[CustomRod(15)]),
            fch.BarChartGroup(x=3, rods=[CustomRod(7.5)]),
            fch.BarChartGroup(x=4, rods=[CustomRod(9)]),
            fch.BarChartGroup(x=5, rods=[CustomRod(11.5)]),
            fch.BarChartGroup(x=6, rods=[CustomRod(6)]),
        ],
        bottom_axis=fch.ChartAxis(
            labels=[
                fch.ChartAxisLabel(value=0, label=ft.Text("M", color=ft.Colors.BLUE)),
                fch.ChartAxisLabel(value=1, label=ft.Text("T", color=ft.Colors.YELLOW)),
                fch.ChartAxisLabel(value=2, label=ft.Text("W", color=ft.Colors.BLUE)),
                fch.ChartAxisLabel(value=3, label=ft.Text("T", color=ft.Colors.YELLOW)),
                fch.ChartAxisLabel(value=4, label=ft.Text("F", color=ft.Colors.BLUE)),
                fch.ChartAxisLabel(value=5, label=ft.Text("S", color=ft.Colors.YELLOW)),
                fch.ChartAxisLabel(value=6, label=ft.Text("S", color=ft.Colors.BLUE)),
            ],
        ),
    )

    page.add(
        ft.SafeArea(
            expand=True,
            content=ft.Container(
                bgcolor=ft.Colors.GREEN_200,
                padding=10,
                border_radius=5,
                expand=True,
                content=chart,
            ),
        )
    )


if __name__ == "__main__":
    ft.run(main)
Properties
animationclass-attributeinstance-attribute
animation: AnimationValue = field(
    default_factory=lambda: Animation(
        duration=Duration(milliseconds=150),
        curve=AnimationCurve.LINEAR,
    )
)
Controls chart implicit animation.
baseline_yclass-attributeinstance-attribute
baseline_y: Number | None = NoneBaseline value for Y axis.
bgcolorclass-attributeinstance-attribute
bgcolor: ColorValue | None = NoneBackground color of the chart.
bottom_axisclass-attributeinstance-attribute
bottom_axis: ChartAxis | None = NoneThe appearance of the bottom axis, its title and labels.
group_alignmentclass-attributeinstance-attribute
group_alignment: MainAxisAlignment = (
    MainAxisAlignment.SPACE_EVENLY
)
The alignment of the bar groups within this chart.
If set to MainAxisAlignment.CENTER,
the space between the groups can be specified using group_spacing.
group_spacingclass-attributeinstance-attribute
group_spacing: Number = 16.0An amount of space between bar groups.
groupsclass-attributeinstance-attribute
groups: list[BarChartGroup] = field(default_factory=list)The list of BarChartGroups to draw.
horizontal_grid_linesclass-attributeinstance-attribute
horizontal_grid_lines: ChartGridLines | None = NoneControls drawing of chart's horizontal lines.
interactiveclass-attributeinstance-attribute
interactive: bool = TrueEnables automatic tooltips when hovering chart bars.
left_axisclass-attributeinstance-attribute
left_axis: ChartAxis | None = NoneThe appearance of the left axis, its title and labels.
max_yclass-attributeinstance-attribute
max_y: Number | None = NoneThe maximum displayed value for Y axis.
min_yclass-attributeinstance-attribute
min_y: Number | None = NoneThe minimum displayed value for Y axis.
right_axisclass-attributeinstance-attribute
right_axis: ChartAxis | None = NoneThe appearance of the right axis, its title and labels.
tooltipclass-attributeinstance-attribute
tooltip: BarChartTooltip | None = field(
    default_factory=lambda: BarChartTooltip()
)
The tooltip configuration for this chart.
If set to None, tooltips will not shown throughout this chart.
top_axisclass-attributeinstance-attribute
top_axis: ChartAxis | None = NoneThe appearance of the top axis, its title and labels.
vertical_grid_linesclass-attributeinstance-attribute
vertical_grid_lines: ChartGridLines | None = NoneControls drawing of chart's vertical lines.
Events
on_eventclass-attributeinstance-attribute
on_event: EventHandler[BarChartEvent] | None = NoneCalled when an event occurs on this chart, such as a click or hover.