PieChart
A pie chart control displaying multiple sections as slices of a circle.

Inherits: LayoutControl
Properties
animation- Controls chart implicit animation.center_space_color- Free space color in the middle of a chart.center_space_radius- Free space radius in the middle of a chart.sections- A list ofPieChartSectioncontrols drawn in a circle.sections_space- A gap betweensections.start_degree_offset- By default,sectionsare drawn from zero degree (right side of the circle) clockwise.
Events
on_event- Fires when a chart section is hovered or clicked.
Examples
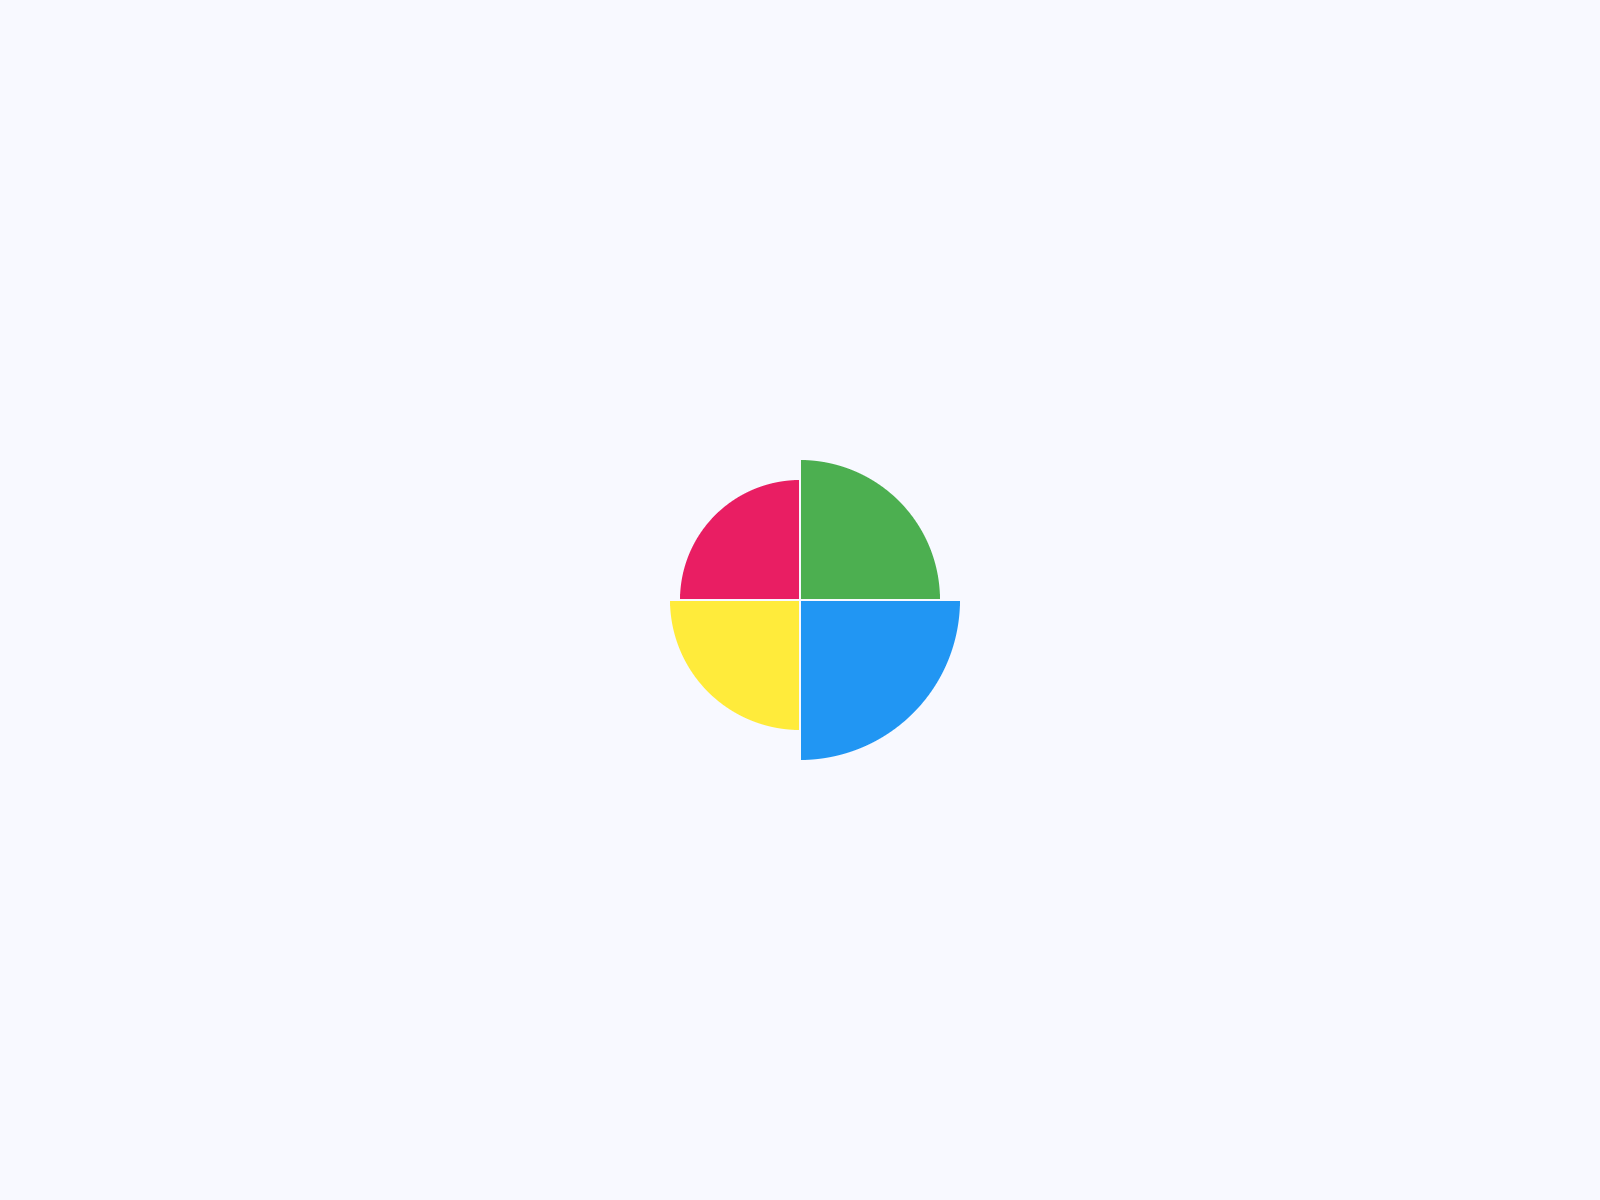
Pie chart with hover borders
play_arrowTry Online
import flet as ft
import flet_charts as fch


def main(page: ft.Page):
    normal_border = ft.BorderSide(0, ft.Colors.with_opacity(0, ft.Colors.WHITE))
    hovered_border = ft.BorderSide(6, ft.Colors.SECONDARY)

    def on_chart_event(e: fch.PieChartEvent):
        for idx, section in enumerate(chart.sections):
            section.border_side = (
                hovered_border if idx == e.section_index else normal_border
            )
        chart.update()

    chart = fch.PieChart(
        sections_space=1,
        center_space_radius=0,
        on_event=on_chart_event,
        expand=True,
        sections=[
            fch.PieChartSection(
                value=25,
                color=ft.Colors.BLUE,
                radius=80,
                border_side=normal_border,
            ),
            fch.PieChartSection(
                value=25,
                color=ft.Colors.YELLOW,
                radius=65,
                border_side=normal_border,
            ),
            fch.PieChartSection(
                value=25,
                color=ft.Colors.PINK,
                radius=60,
                border_side=normal_border,
            ),
            fch.PieChartSection(
                value=25,
                color=ft.Colors.GREEN,
                radius=70,
                border_side=normal_border,
            ),
        ],
    )

    page.add(ft.SafeArea(expand=True, content=chart))


if __name__ == "__main__":
    ft.run(main)
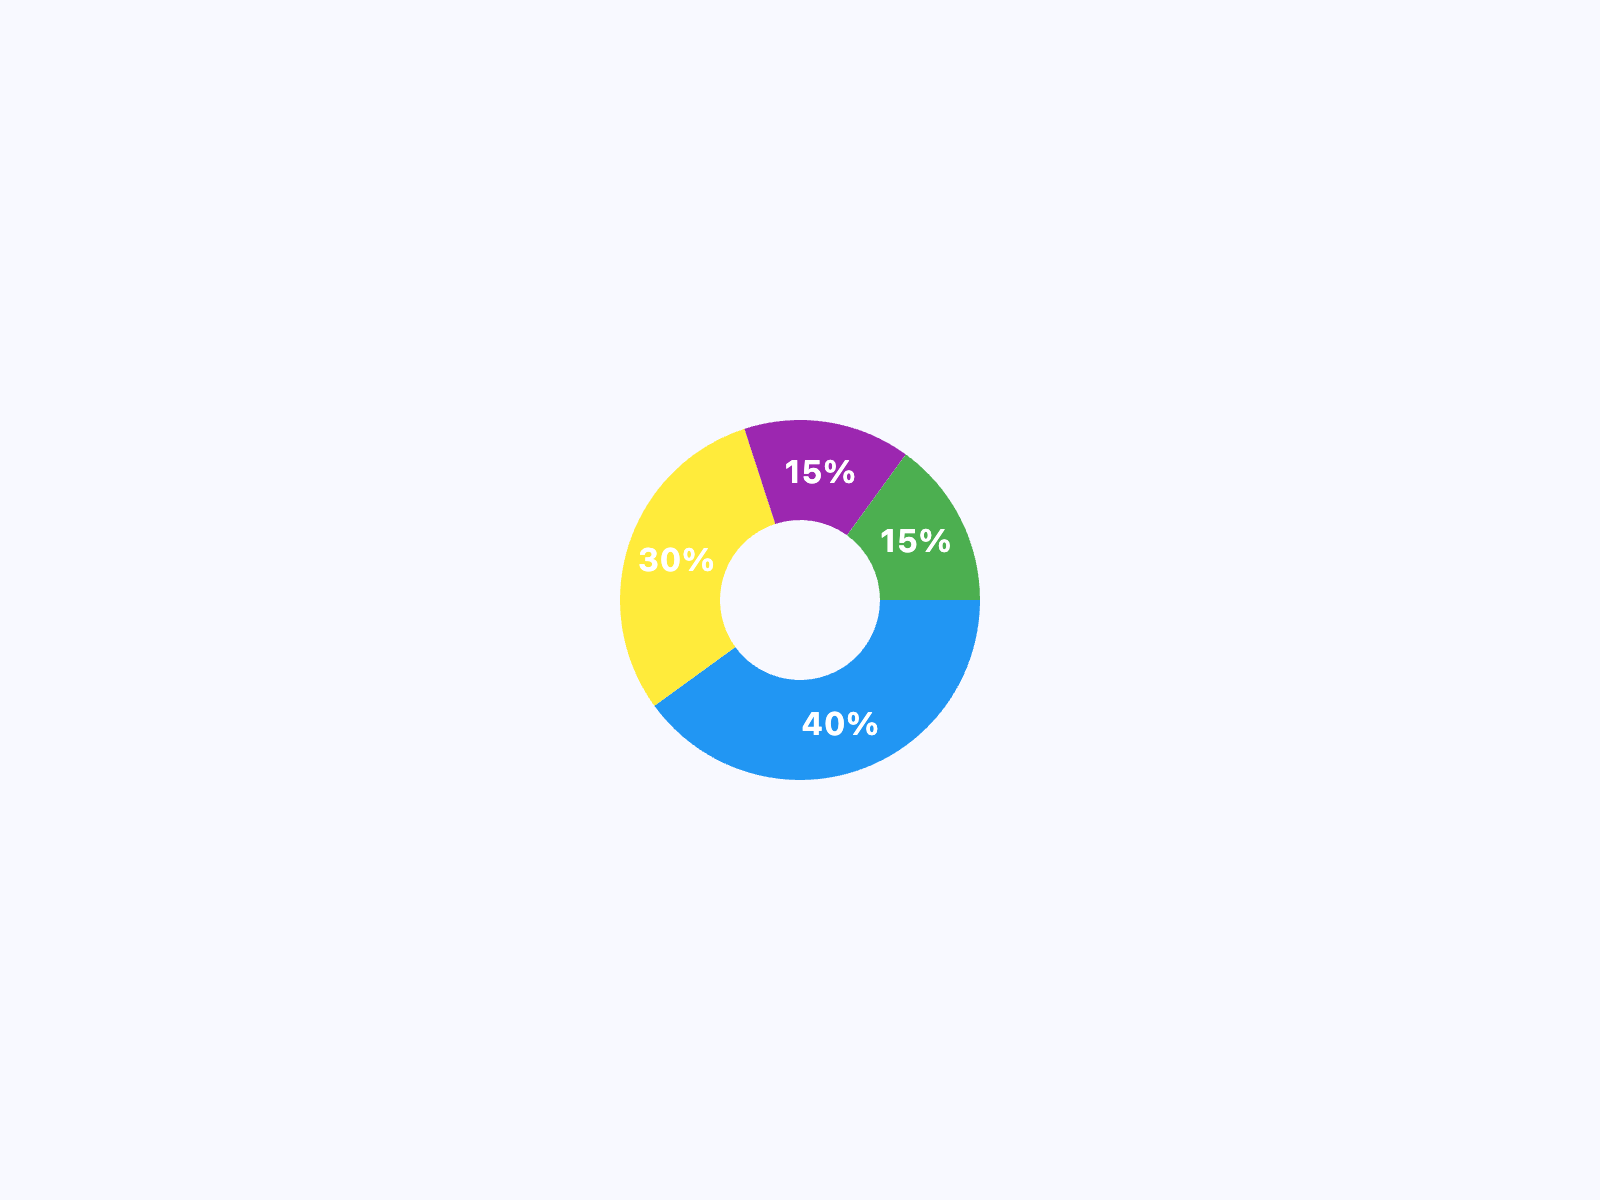
Pie chart with hover sections
play_arrowTry Online
import flet as ft
import flet_charts as fch

NORMAL_RADIUS = 50
HOVER_RADIUS = 60
NORMAL_TITLE_STYLE = ft.TextStyle(
    size=16, color=ft.Colors.WHITE, weight=ft.FontWeight.BOLD
)
HOVER_TITLE_STYLE = ft.TextStyle(
    size=22,
    color=ft.Colors.WHITE,
    weight=ft.FontWeight.BOLD,
    shadow=ft.BoxShadow(blur_radius=2, color=ft.Colors.BLACK_54),
)


def main(page: ft.Page):
    def on_chart_event(e: fch.PieChartEvent):
        for idx, section in enumerate(chart.sections):
            if idx == e.section_index:
                section.radius = HOVER_RADIUS
                section.title_style = HOVER_TITLE_STYLE
            else:
                section.radius = NORMAL_RADIUS
                section.title_style = NORMAL_TITLE_STYLE
        chart.update()

    chart = fch.PieChart(
        expand=True,
        sections_space=0,
        center_space_radius=40,
        on_event=on_chart_event,
        sections=[
            fch.PieChartSection(
                value=40,
                title="40%",
                title_style=NORMAL_TITLE_STYLE,
                color=ft.Colors.BLUE,
                radius=NORMAL_RADIUS,
            ),
            fch.PieChartSection(
                value=30,
                title="30%",
                title_style=NORMAL_TITLE_STYLE,
                color=ft.Colors.YELLOW,
                radius=NORMAL_RADIUS,
            ),
            fch.PieChartSection(
                value=15,
                title="15%",
                title_style=NORMAL_TITLE_STYLE,
                color=ft.Colors.PURPLE,
                radius=NORMAL_RADIUS,
            ),
            fch.PieChartSection(
                value=15,
                title="15%",
                title_style=NORMAL_TITLE_STYLE,
                color=ft.Colors.GREEN,
                radius=NORMAL_RADIUS,
            ),
        ],
    )

    page.add(ft.SafeArea(expand=True, content=chart))


if __name__ == "__main__":
    ft.run(main)
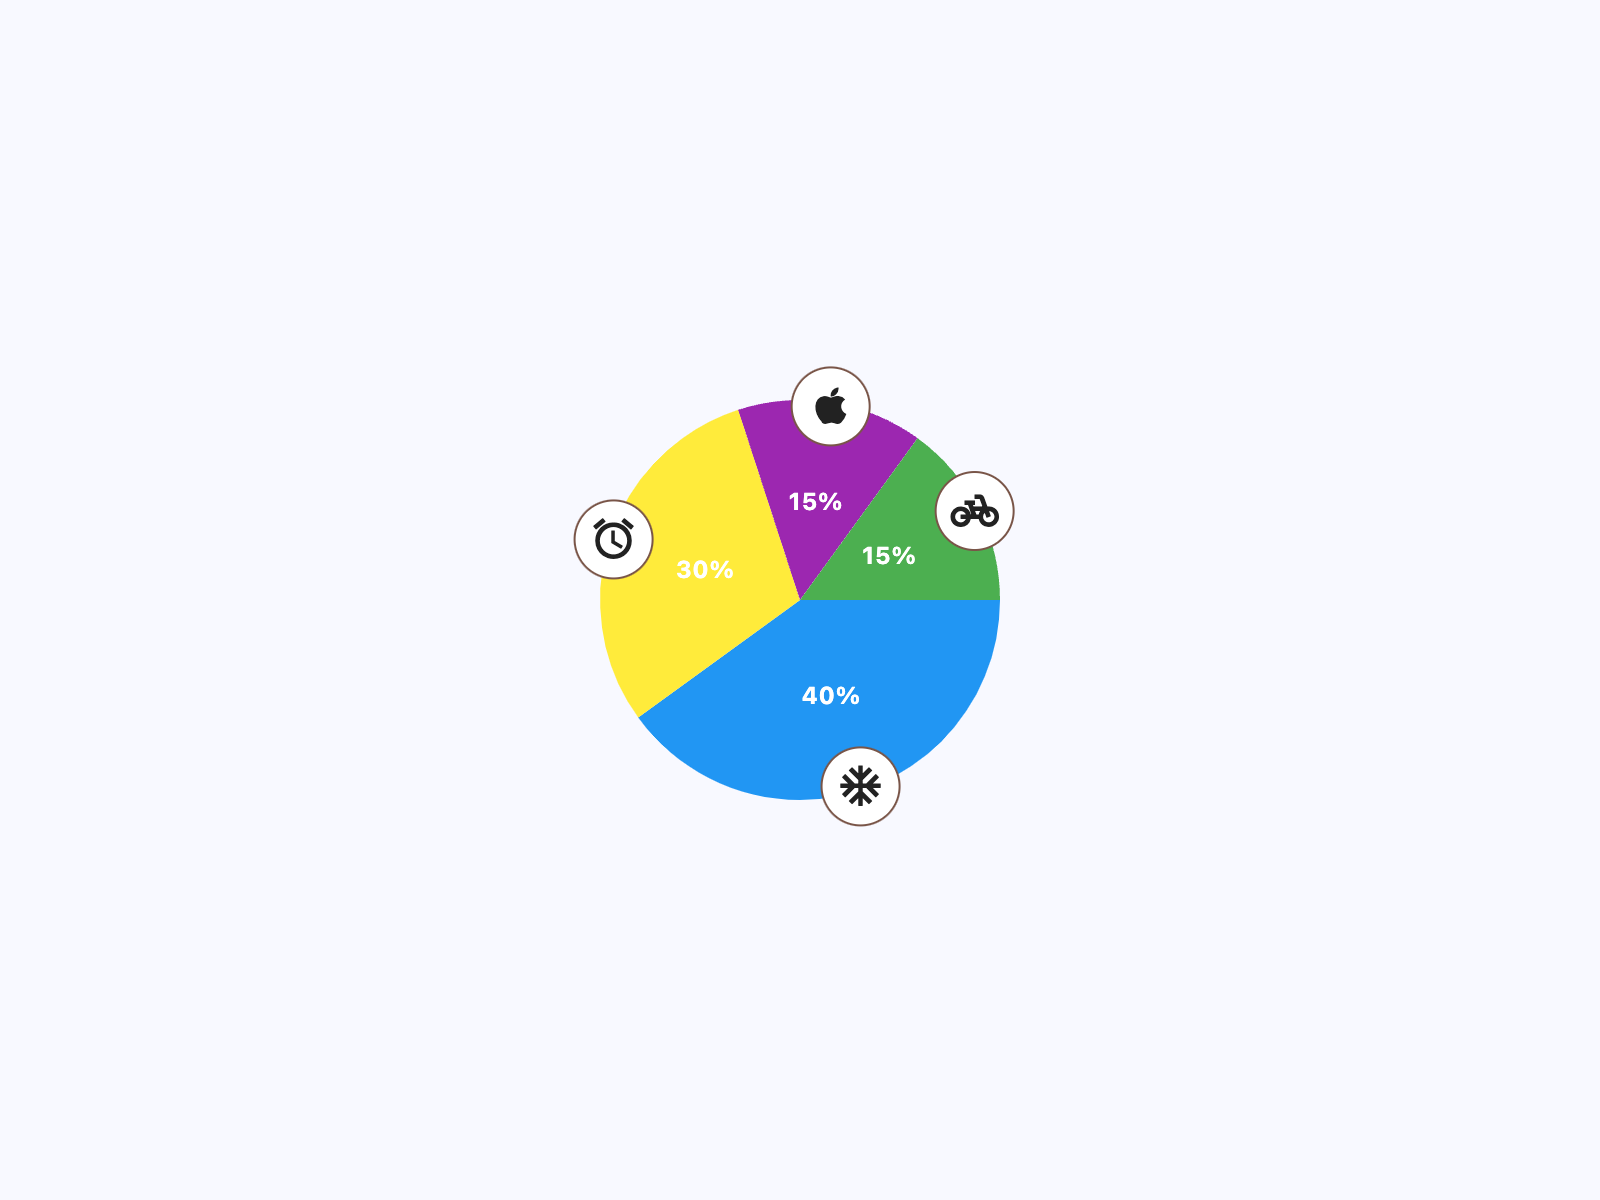
Pie chart with icon badges
play_arrowTry Online
import flet as ft
import flet_charts as fch

NORMAL_RADIUS = 100
HOVER_RADIUS = 110
NORMAL_TITLE_STYLE = ft.TextStyle(
    size=12, color=ft.Colors.WHITE, weight=ft.FontWeight.BOLD
)
HOVER_TITLE_STYLE = ft.TextStyle(
    size=16,
    color=ft.Colors.WHITE,
    weight=ft.FontWeight.BOLD,
    shadow=ft.BoxShadow(blur_radius=2, color=ft.Colors.BLACK_54),
)
NORMAL_BADGE_SIZE = 40
HOVER_BADGE_SIZE = 50


class SectionBadge(ft.Container):
    def __init__(self, icon: ft.IconData, size: int = NORMAL_BADGE_SIZE):
        super().__init__(
            content=ft.Icon(icon),
            width=size,
            height=size,
            border=ft.Border.all(1, ft.Colors.BROWN),
            border_radius=size / 2,
            bgcolor=ft.Colors.WHITE,
        )


def main(page: ft.Page):
    def on_chart_event(e: fch.PieChartEvent):
        for idx, section in enumerate(chart.sections):
            if idx == e.section_index:
                section.radius = HOVER_RADIUS
                section.title_style = HOVER_TITLE_STYLE
            else:
                section.radius = NORMAL_RADIUS
                section.title_style = NORMAL_TITLE_STYLE
        chart.update()

    chart = fch.PieChart(
        sections_space=0,
        center_space_radius=0,
        on_event=on_chart_event,
        expand=True,
        sections=[
            fch.PieChartSection(
                value=40,
                title="40%",
                title_style=NORMAL_TITLE_STYLE,
                color=ft.Colors.BLUE,
                radius=NORMAL_RADIUS,
                badge=SectionBadge(ft.Icons.AC_UNIT),
                badge_position=0.98,
            ),
            fch.PieChartSection(
                value=30,
                title="30%",
                title_style=NORMAL_TITLE_STYLE,
                color=ft.Colors.YELLOW,
                radius=NORMAL_RADIUS,
                badge=SectionBadge(ft.Icons.ACCESS_ALARM),
                badge_position=0.98,
            ),
            fch.PieChartSection(
                value=15,
                title="15%",
                title_style=NORMAL_TITLE_STYLE,
                color=ft.Colors.PURPLE,
                radius=NORMAL_RADIUS,
                badge=SectionBadge(ft.Icons.APPLE),
                badge_position=0.98,
            ),
            fch.PieChartSection(
                value=15,
                title="15%",
                title_style=NORMAL_TITLE_STYLE,
                color=ft.Colors.GREEN,
                radius=NORMAL_RADIUS,
                badge=SectionBadge(ft.Icons.PEDAL_BIKE),
                badge_position=0.98,
            ),
        ],
    )

    page.add(ft.SafeArea(expand=True, content=chart))


if __name__ == "__main__":
    ft.run(main)
Properties
animationclass-attributeinstance-attribute
animation: AnimationValue = field(
    default_factory=lambda: Animation(
        duration=Duration(milliseconds=150),
        curve=AnimationCurve.LINEAR,
    )
)
Controls chart implicit animation.
center_space_colorclass-attributeinstance-attribute
center_space_color: ColorValue | None = NoneFree space color in the middle of a chart.
center_space_radiusclass-attributeinstance-attribute
center_space_radius: Number | None = NoneFree space radius in the middle of a chart.
sectionsclass-attributeinstance-attribute
sections: list[PieChartSection] = field(
    default_factory=list
)
A list of PieChartSection
controls drawn in a circle.
Events
on_eventclass-attributeinstance-attribute
on_event: EventHandler[PieChartEvent] | None = NoneFires when a chart section is hovered or clicked.