RadarChart
A radar chart made of multiple datasets.
fch.RadarChart(
    titles=[fch.RadarChartTitle(text="winter"), ...],
    radar_shape=fch.RadarShape.CIRCLE,
    data_sets=[
        fch.RadarDataSet(
            fill_color=ft.Colors.with_opacity(0.2, ft.Colors.BLUE_GREY_700),
            entries=[fch.RadarDataSetEntry(130), ...],
        ),
        ...,
    ],
)

Inherits: LayoutControl
Properties
animation- Controls the implicit animation applied when updating this chart.border- The border drawn around this chart.center_min_value- Whether minimum entry values should be positioned at the center of this chart.data_sets- A list ofRadarDataSetcontrols rendered on the chart.grid_border_side- The style of the radar grid lines.interactive- Enables touch interactions and event notifications.long_press_duration- The duration before a long-press event fires.radar_bgcolor- The background color of the radar area.radar_border_side- The outline drawn around the radar area.radar_shape- The shape of the radar area.tick_border_side- The style of the tick rings.tick_count- Number of tick rings drawn from the centre to the edge.ticks_text_style- The text style used to draw tick labels.title_position_percentage_offset- Defines the relative distance of titles from the chart center.title_text_style- The text style applied to titles around this chart.titles- The titles shown around this chart, matching the number of entries per set.touch_spot_threshold- The radius (in logical pixels) used to detect nearby entries for touches.
Events
on_event- Called when the chart is interacted with.
Examples
Radar chart
import flet as ft
import flet_charts as fch
def main(page: ft.Page):
page.title = "Radar chart"
page.padding = 20
# page.vertical_alignment = page.horizontal_alignment = "center"
page.theme_mode = ft.ThemeMode.LIGHT
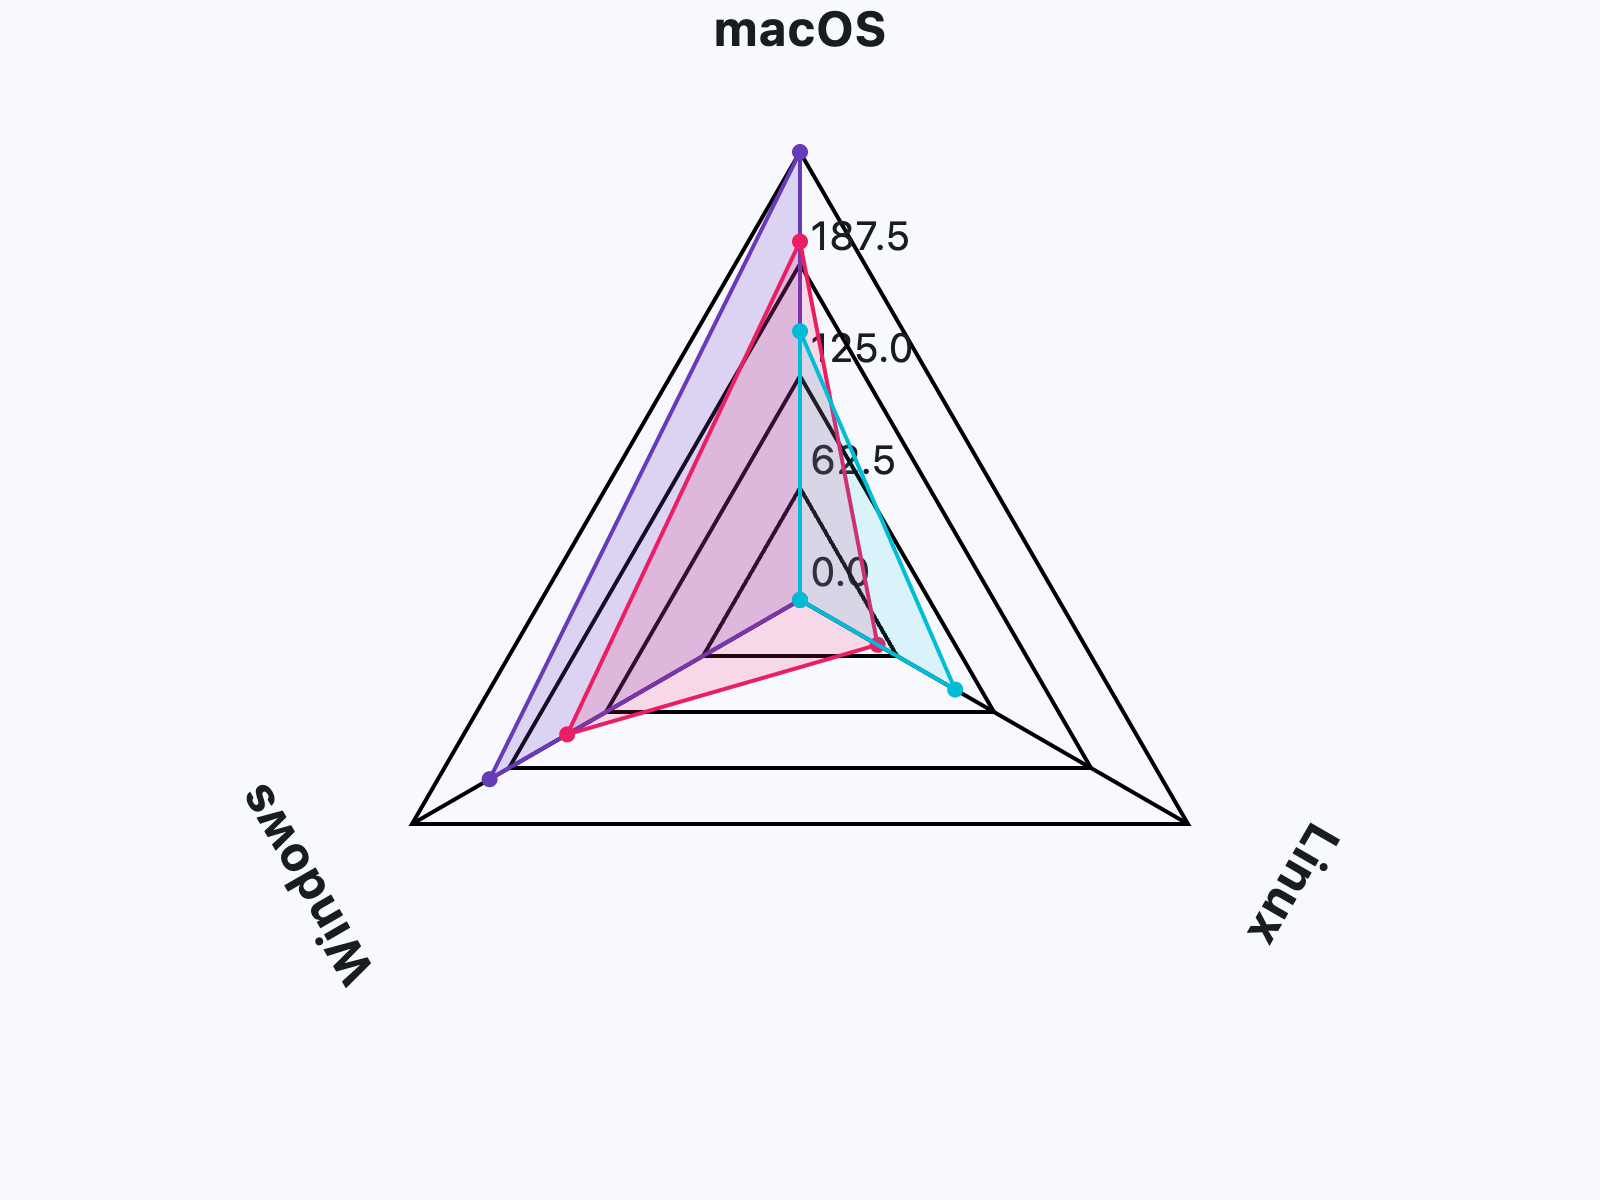
categories = ["macOS", "Linux", "Windows"]
page.add(
ft.SafeArea(
expand=True,
content=fch.RadarChart(
expand=True,
titles=[fch.RadarChartTitle(text=label) for label in categories],
center_min_value=True,
tick_count=4,
ticks_text_style=ft.TextStyle(size=20, color=ft.Colors.ON_SURFACE),
title_text_style=ft.TextStyle(
size=24, weight=ft.FontWeight.BOLD, color=ft.Colors.ON_SURFACE
),
on_event=lambda e: print(e.type),
data_sets=[
fch.RadarDataSet(
fill_color=ft.Colors.with_opacity(0.2, ft.Colors.DEEP_PURPLE),
border_color=ft.Colors.DEEP_PURPLE,
entry_radius=4,
entries=[
fch.RadarDataSetEntry(300),
fch.RadarDataSetEntry(50),
fch.RadarDataSetEntry(250),
],
),
fch.RadarDataSet(
fill_color=ft.Colors.with_opacity(0.15, ft.Colors.PINK),
border_color=ft.Colors.PINK,
entry_radius=4,
entries=[
fch.RadarDataSetEntry(250),
fch.RadarDataSetEntry(100),
fch.RadarDataSetEntry(200),
],
),
fch.RadarDataSet(
fill_color=ft.Colors.with_opacity(0.12, ft.Colors.CYAN),
border_color=ft.Colors.CYAN,
entry_radius=4,
entries=[
fch.RadarDataSetEntry(200),
fch.RadarDataSetEntry(150),
fch.RadarDataSetEntry(50),
],
),
],
),
)
)
if __name__ == "__main__":
ft.run(main)
Properties
animationclass-attributeinstance-attribute
animation: AnimationValue = field(
    default_factory=lambda: Animation(
        duration=Duration(milliseconds=150),
        curve=AnimationCurve.LINEAR,
    )
)
Controls the implicit animation applied when updating this chart.
borderclass-attributeinstance-attribute
border: Border | None = NoneThe border drawn around this chart.
center_min_valueclass-attributeinstance-attribute
center_min_value: bool = FalseWhether minimum entry values should be positioned at the center of this chart.
data_setsclass-attributeinstance-attribute
data_sets: list[RadarDataSet] = field(default_factory=list)A list of RadarDataSet controls rendered on the chart.
grid_border_sideclass-attributeinstance-attribute
grid_border_side: BorderSide = field(
    default_factory=lambda: BorderSide(width=2.0)
)
The style of the radar grid lines.
interactiveclass-attributeinstance-attribute
interactive: bool = TrueEnables touch interactions and event notifications.
long_press_durationclass-attributeinstance-attribute
long_press_duration: DurationValue | None = NoneThe duration before a long-press event fires.
radar_bgcolorclass-attributeinstance-attribute
radar_bgcolor: ColorValue = Colors.TRANSPARENTThe background color of the radar area.
radar_border_sideclass-attributeinstance-attribute
radar_border_side: BorderSide = field(
    default_factory=lambda: BorderSide(width=2.0)
)
The outline drawn around the radar area.
radar_shapeclass-attributeinstance-attribute
radar_shape: RadarShape = RadarShape.POLYGONThe shape of the radar area.
tick_border_sideclass-attributeinstance-attribute
tick_border_side: BorderSide = field(
    default_factory=lambda: BorderSide(width=2.0)
)
The style of the tick rings.
tick_countclass-attributeinstance-attribute
tick_count: Number = 1Number of tick rings drawn from the centre to the edge.
Must be greater than or equal to 1.
Raises:
- ValueError - If set to a value less than
1.
ticks_text_styleclass-attributeinstance-attribute
ticks_text_style: TextStyle | None = NoneThe text style used to draw tick labels.
title_position_percentage_offsetclass-attributeinstance-attribute
title_position_percentage_offset: Number = 0.2Defines the relative distance of titles from the chart center.
0draws titles near the inside edge of each section.1draws titles near the outside edge of each section.
Must be between 0 and 1 (inclusive).
Raises:
- ValueError - If set to a value less than
0or greater than1.
title_text_styleclass-attributeinstance-attribute
title_text_style: TextStyle | None = NoneThe text style applied to titles around this chart.
titlesclass-attributeinstance-attribute
titles: list[RadarChartTitle] = field(default_factory=list)The titles shown around this chart, matching the number of entries per set.
Events
on_eventclass-attributeinstance-attribute
on_event: EventHandler[RadarChartEvent] | None = NoneCalled when the chart is interacted with.