CandlestickChart
Draws a candlestick chart representing OHLC values.
fch.CandlestickChart(
    min_x=-1,
    max_x=2,
    min_y=20,
    max_y=30,
    bgcolor=ft.Colors.AMBER_200,
    spots=[
        fch.CandlestickChartSpot(
            x=0,
            open=22.6,
            high=28.3,
            low=21.4,
            close=24.1,
        ),
        ...,
    ],
)
Inherits: LayoutControl
Properties
animation- Controls chart implicit animations.baseline_x- Baseline value on the X axis.baseline_y- Baseline value on the Y axis.bgcolor- Background color of the chart.border- Border drawn around the chart.bottom_axis- Appearance of the bottom axis, its title and labels.horizontal_grid_lines- Horizontal grid lines configuration.interactive- Enables automatic tooltips and highlighting when hovering the chart.left_axis- Appearance of the left axis, its title and labels.long_press_duration- The duration of a long press on the chart.max_x- Maximum value displayed on the X axis.max_y- Maximum value displayed on the Y axis.min_x- Minimum value displayed on the X axis.min_y- Minimum value displayed on the Y axis.right_axis- Appearance of the right axis, its title and labels.rotation_quarter_turns- Number of quarter turns (90-degree increments) to rotate the chart.show_tooltips_for_selected_spots_only- Whether to permanently and only show the tooltips of spots with theirselectedproperty set toTrue.spots- Candlesticks to display on the chart.tooltip- Tooltip configuration for the chart.top_axis- Appearance of the top axis, its title and labels.touch_spot_threshold- The distance threshold to consider a touch near a candlestick.vertical_grid_lines- Vertical grid lines configuration.
Events
on_event- Called when an event occurs on this chart.
Examples
Candlestick chart
import flet as ft
import flet_charts as fch
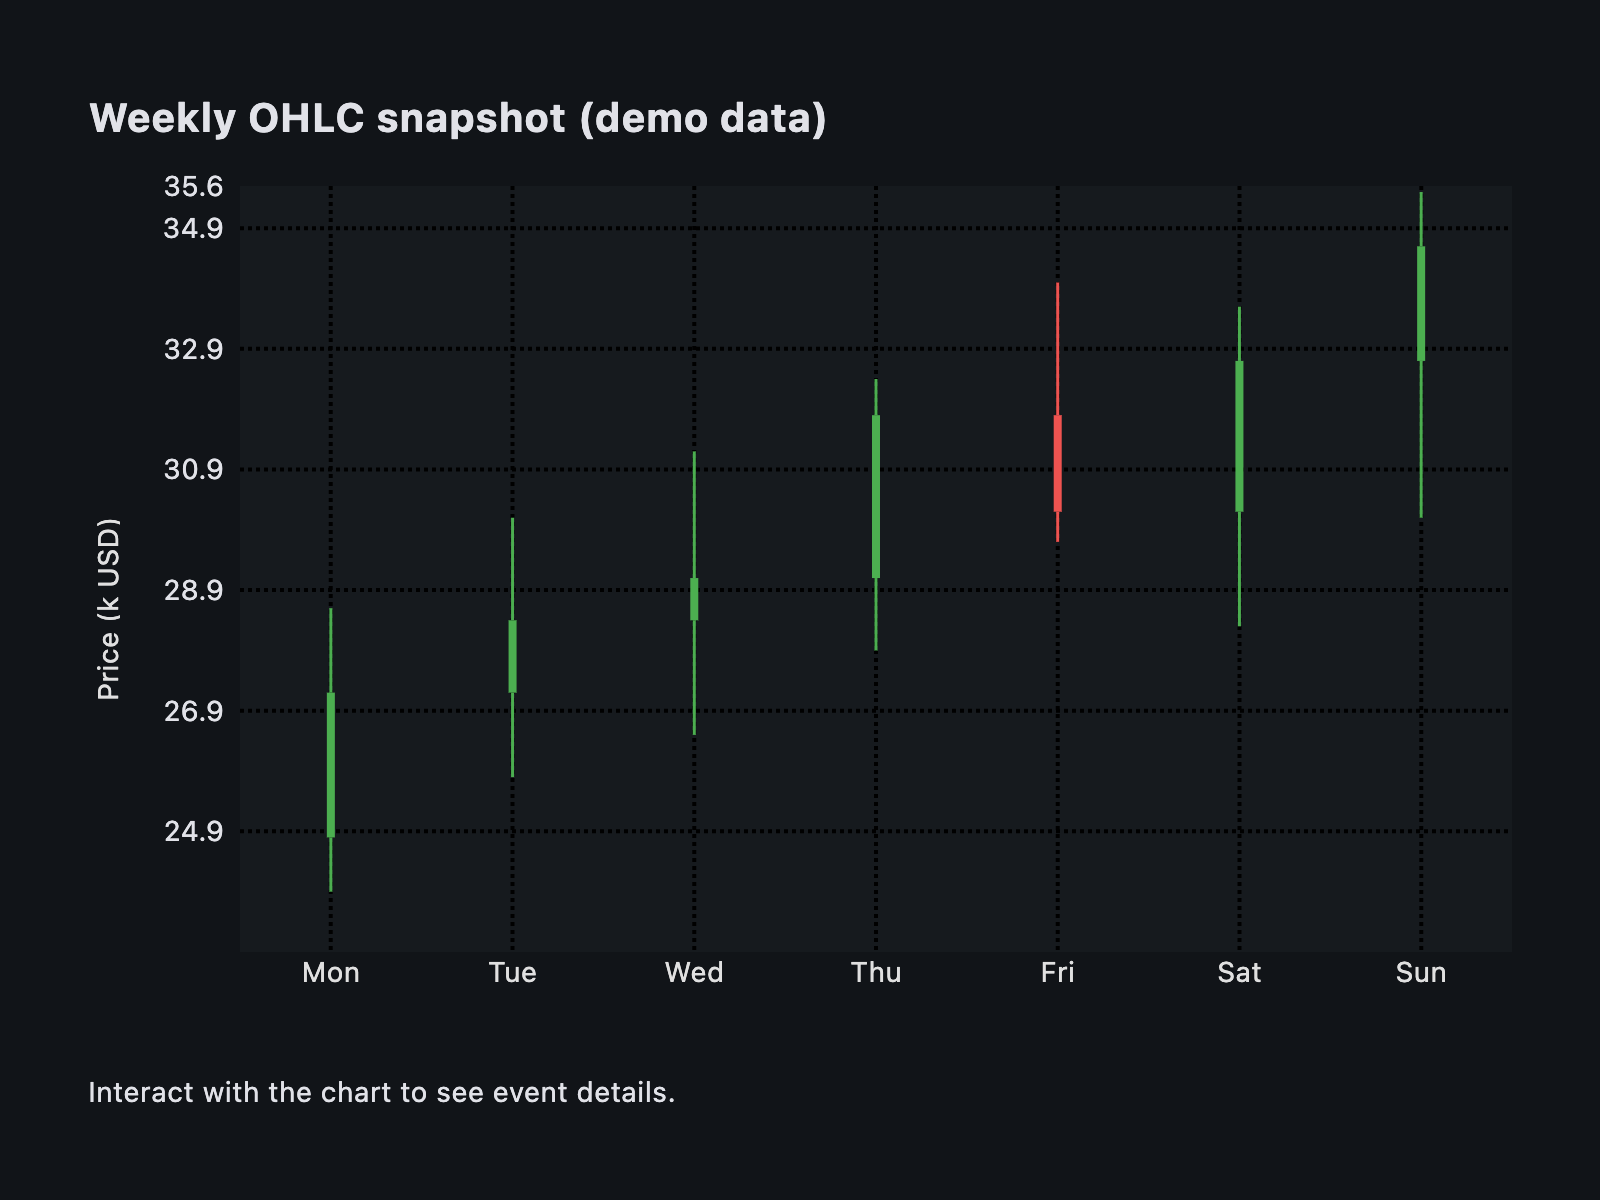
CANDLE_DATA = [
("Mon", 24.8, 28.6, 23.9, 27.2),
("Tue", 27.2, 30.1, 25.8, 28.4),
("Wed", 28.4, 31.2, 26.5, 29.1),
("Thu", 29.1, 32.4, 27.9, 31.8),
("Fri", 31.8, 34.0, 29.7, 30.2),
("Sat", 30.2, 33.6, 28.3, 32.7),
("Sun", 32.7, 35.5, 30.1, 34.6),
]
def build_spots() -> list[fch.CandlestickChartSpot]:
"""Create candlestick spots from the static data."""
spots: list[fch.CandlestickChartSpot] = []
for index, (label, open_, high, low, close) in enumerate(CANDLE_DATA):
spots.append(
fch.CandlestickChartSpot(
x=float(index),
open=open_,
high=high,
low=low,
close=close,
selected=index == len(CANDLE_DATA) - 1,
tooltip=fch.CandlestickChartSpotTooltip(
text=(
f"{label}\n"
f"Open: {open_:0.1f}\n"
f"High: {high:0.1f}\n"
f"Low : {low:0.1f}\n"
f"Close: {close:0.1f}"
),
bottom_margin=12,
),
)
)
return spots
def main(page: ft.Page):
page.title = "Candlestick chart"
page.padding = 24
page.theme_mode = ft.ThemeMode.DARK
info = ft.Text("Interact with the chart to see event details.")
spots = build_spots()
min_x = -0.5
max_x = len(spots) - 0.5
min_y = min(low for _, _, _, low, _ in CANDLE_DATA) - 1
max_y = max(high for _, _, _, _, high in CANDLE_DATA) + 1
def handle_event(e: fch.CandlestickChartEvent):
if e.spot_index is not None and e.spot_index >= 0:
label, open_, high, low, close = CANDLE_DATA[e.spot_index]
info.value = (
f"{e.type.value} • {label}: "
f"O {open_:0.1f} H {high:0.1f} L {low:0.1f} C {close:0.1f}"
)
else:
info.value = f"{e.type.value} • outside candlesticks"
info.update()
chart = fch.CandlestickChart(
expand=True,
min_x=min_x,
max_x=max_x,
min_y=min_y,
max_y=max_y,
baseline_x=0,
baseline_y=min_y,
bgcolor=ft.Colors.with_opacity(0.2, ft.Colors.BLUE_GREY_900),
horizontal_grid_lines=fch.ChartGridLines(interval=2, dash_pattern=[2, 2]),
vertical_grid_lines=fch.ChartGridLines(interval=1, dash_pattern=[2, 2]),
left_axis=fch.ChartAxis(
label_spacing=2,
label_size=60,
title=ft.Text("Price (k USD)", color=ft.Colors.GREY_300),
show_min=False,
),
bottom_axis=fch.ChartAxis(
labels=[
fch.ChartAxisLabel(
value=index,
label=ft.Text(name, color=ft.Colors.GREY_300),
)
for index, (name, *_rest) in enumerate(CANDLE_DATA)
],
label_spacing=1,
label_size=40,
show_min=False,
show_max=False,
),
spots=spots,
tooltip=fch.CandlestickChartTooltip(
bgcolor=ft.Colors.BLUE_GREY_800,
horizontal_alignment=fch.HorizontalAlignment.CENTER,
fit_inside_horizontally=True,
),
on_event=handle_event,
)
page.add(
ft.SafeArea(
expand=True,
content=ft.Container(
expand=True,
border_radius=16,
padding=20,
content=ft.Column(
expand=True,
spacing=20,
controls=[
ft.Text(
"Weekly OHLC snapshot (demo data)",
size=20,
weight=ft.FontWeight.BOLD,
),
chart,
info,
],
),
),
)
)
if __name__ == "__main__":
ft.run(main)
Properties
animationclass-attributeinstance-attribute
animation: AnimationValue = field(
    default_factory=lambda: Animation(
        duration=Duration(milliseconds=150),
        curve=AnimationCurve.LINEAR,
    )
)
Controls chart implicit animations.
baseline_xclass-attributeinstance-attribute
baseline_x: Number | None = NoneBaseline value on the X axis.
baseline_yclass-attributeinstance-attribute
baseline_y: Number | None = NoneBaseline value on the Y axis.
bgcolorclass-attributeinstance-attribute
bgcolor: ColorValue | None = NoneBackground color of the chart.
bottom_axisclass-attributeinstance-attribute
bottom_axis: ChartAxis | None = NoneAppearance of the bottom axis, its title and labels.
horizontal_grid_linesclass-attributeinstance-attribute
horizontal_grid_lines: ChartGridLines | None = NoneHorizontal grid lines configuration.
interactiveclass-attributeinstance-attribute
interactive: bool = TrueEnables automatic tooltips and highlighting when hovering the chart.
left_axisclass-attributeinstance-attribute
left_axis: ChartAxis | None = NoneAppearance of the left axis, its title and labels.
long_press_durationclass-attributeinstance-attribute
long_press_duration: DurationValue | None = NoneThe duration of a long press on the chart.
max_xclass-attributeinstance-attribute
max_x: Number | None = NoneMaximum value displayed on the X axis.
max_yclass-attributeinstance-attribute
max_y: Number | None = NoneMaximum value displayed on the Y axis.
min_xclass-attributeinstance-attribute
min_x: Number | None = NoneMinimum value displayed on the X axis.
min_yclass-attributeinstance-attribute
min_y: Number | None = NoneMinimum value displayed on the Y axis.
right_axisclass-attributeinstance-attribute
right_axis: ChartAxis | None = NoneAppearance of the right axis, its title and labels.
rotation_quarter_turnsclass-attributeinstance-attribute
rotation_quarter_turns: Number = 0Number of quarter turns (90-degree increments) to rotate the chart.
show_tooltips_for_selected_spots_onlyclass-attributeinstance-attribute
show_tooltips_for_selected_spots_only: bool = FalseWhether to permanently and only show the tooltips of spots with their
selected property set to True.
spotsclass-attributeinstance-attribute
spots: list[CandlestickChartSpot] = field(
    default_factory=list
)
Candlesticks to display on the chart.
tooltipclass-attributeinstance-attribute
tooltip: CandlestickChartTooltip | None = field(
    default_factory=lambda: CandlestickChartTooltip()
)
Tooltip configuration for the chart.
top_axisclass-attributeinstance-attribute
top_axis: ChartAxis | None = NoneAppearance of the top axis, its title and labels.
touch_spot_thresholdclass-attributeinstance-attribute
touch_spot_threshold: Number = 4The distance threshold to consider a touch near a candlestick.
vertical_grid_linesclass-attributeinstance-attribute
vertical_grid_lines: ChartGridLines | None = NoneVertical grid lines configuration.
Events
on_eventclass-attributeinstance-attribute
on_event: EventHandler[CandlestickChartEvent] | None = (
    None
)
Called when an event occurs on this chart.