MatplotlibChartWithToolbar
Composite control that combines a MatplotlibChart with a ready-made toolbar UI.
Warning
This control requires the matplotlib
Python package to be installed.
See this installation guide for more information.
Inherits: Column
Properties
figure- Matplotlib figure to draw - an instance ofmatplotlib.figure.Figure.
Methods
builddownload_click- Export the figure in the selected format and prompt user to save it.on_message- Show status text produced by the underlying chart toolbar backend.on_toolbar_update- Synchronize back/forward button enabled state with chart history.pan_click- Toggle pan mode and ensure zoom mode is turned off.zoom_click- Toggle zoom mode and ensure pan mode is turned off.
Examples
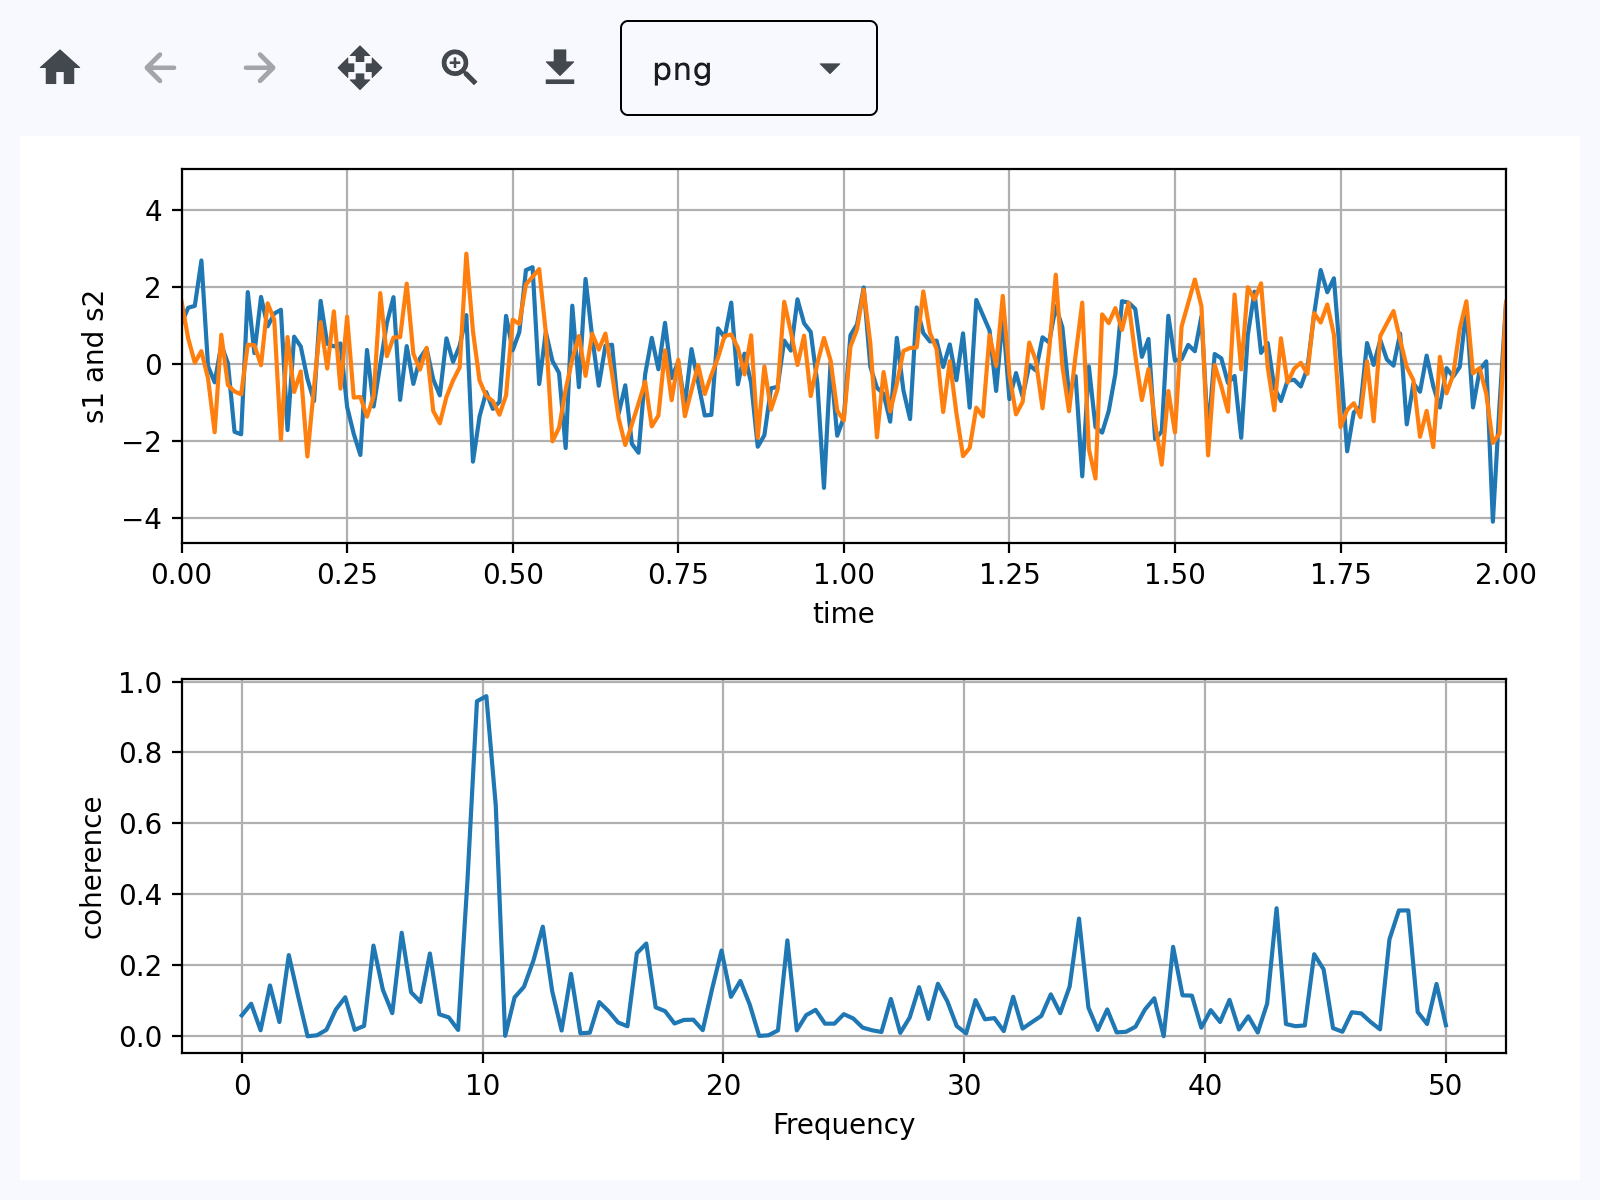
Toolbar
Based on an official Matplotlib example.
play_arrowTry Online
import matplotlib.pyplot as plt
import numpy as np

import flet as ft
import flet_charts as fch


def main(page: ft.Page):
    # Fixing random state for reproducibility
    np.random.seed(19680801)

    dt = 0.01
    t = np.arange(0, 30, dt)
    nse1 = np.random.randn(len(t))  # white noise 1
    nse2 = np.random.randn(len(t))  # white noise 2

    # Two signals with a coherent part at 10Hz and a random part
    s1 = np.sin(2 * np.pi * 10 * t) + nse1
    s2 = np.sin(2 * np.pi * 10 * t) + nse2

    fig, axs = plt.subplots(2, 1)
    axs[0].plot(t, s1, t, s2)
    axs[0].set_xlim(0, 2)
    axs[0].set_xlabel("time")
    axs[0].set_ylabel("s1 and s2")
    axs[0].grid(True)

    cxy, f = axs[1].cohere(s1, s2, 256, 1.0 / dt)
    axs[1].set_ylabel("coherence")

    fig.tight_layout()

    page.add(
        ft.SafeArea(
            expand=True,
            content=fch.MatplotlibChartWithToolbar(figure=fig, expand=True),
        )
    )


if __name__ == "__main__":
    ft.run(main)
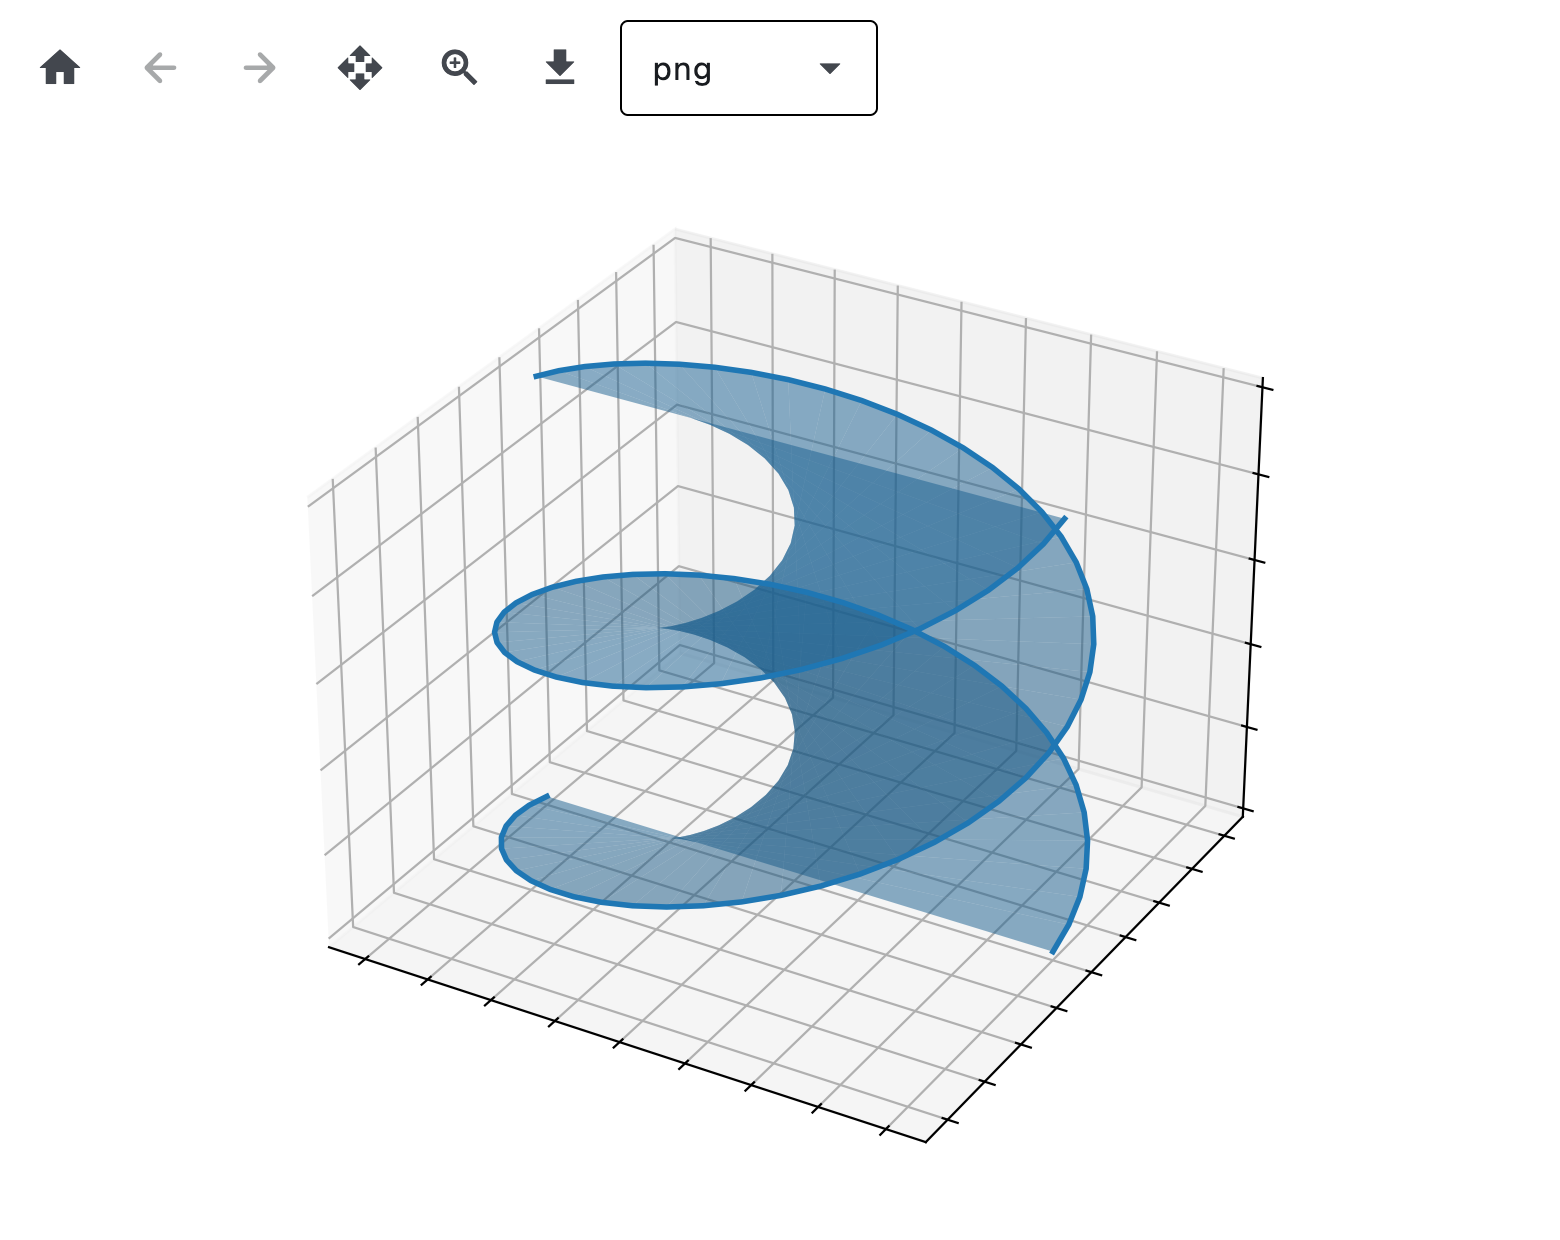
Three D
play_arrowTry Online
import asyncio
import logging
import time
from collections import deque
from dataclasses import dataclass

import matplotlib.pyplot as plt

import flet as ft
import flet_charts

logging.basicConfig(level=logging.INFO)


@dataclass
class _Frame:
    t: float
    size: int


class FrameStats:
    """Rolling counters for the matplotlib WebAgg-style frame stream.

    Cumulative averages for per-frame size + total bytes (lifetime of the
    run); a short sliding window for transfer speed and FPS so the bar
    reflects current activity rather than being dragged down by idle time.

    Latency split (also sliding-window):

    * `dart_ms` — time from a frame leaving Python (`apply_full/diff` call)
      to Dart's `[0xFF]` ack arriving. This is Dart-side decode + paint +
      ack transit. Transit is microseconds, so essentially decode + paint.
    * `mpl_ms` — time from one ack arriving to the next frame leaving
      Python. Combines matplotlib's render of the next frame and any
      idle time waiting for matplotlib to react to the next "draw"
      request. Under sustained interactive load (continuous dragging)
      idle ≈ 0 and this is dominated by matplotlib's render cost.
    """

    WINDOW_SECONDS = 2.0

    def __init__(self) -> None:
        self.full_count = 0
        self.full_total = 0
        self.diff_count = 0
        self.diff_total = 0
        self.raw_count = 0
        self.raw_total = 0
        self.bytes_total = 0
        self._recent: deque[_Frame] = deque()
        # Latency tracking: each entry is (timestamp_when_observed, latency_seconds).
        self._dart_latencies: deque[tuple[float, float]] = deque()
        self._mpl_gaps: deque[tuple[float, float]] = deque()
        # In-flight bookkeeping for pairing send with ack.
        self._inflight_send_ts: float | None = None
        self._last_ack_ts: float | None = None

    def record_send(self, size: int, kind: str) -> None:
        """Frame about to leave Python — record size and mark in-flight.

        `kind` is "raw" (uncompressed RGBA full frame, local transports),
        "full" or "diff" (PNG frames, remote transports).
        """
        now = time.monotonic()
        if kind == "raw":
            self.raw_count += 1
            self.raw_total += size
        elif kind == "full":
            self.full_count += 1
            self.full_total += size
        else:
            self.diff_count += 1
            self.diff_total += size
        self.bytes_total += size
        self._recent.append(_Frame(now, size))
        self._evict(now)
        # mpl-side gap: how long since the previous ack.
        if self._last_ack_ts is not None:
            self._mpl_gaps.append((now, now - self._last_ack_ts))
            self._evict_latency_window(self._mpl_gaps, now)
        self._inflight_send_ts = now

    def record_ack(self) -> None:
        """Dart confirms the frame painted — close the dart-side timing."""
        now = time.monotonic()
        if self._inflight_send_ts is not None:
            self._dart_latencies.append((now, now - self._inflight_send_ts))
            self._evict_latency_window(self._dart_latencies, now)
            self._inflight_send_ts = None
        self._last_ack_ts = now

    def _evict(self, now: float) -> None:
        cutoff = now - self.WINDOW_SECONDS
        while self._recent and self._recent[0].t < cutoff:
            self._recent.popleft()

    def _evict_latency_window(
        self, window: deque[tuple[float, float]], now: float
    ) -> None:
        cutoff = now - self.WINDOW_SECONDS
        while window and window[0][0] < cutoff:
            window.popleft()

    @property
    def avg_full(self) -> float:
        return self.full_total / self.full_count if self.full_count else 0.0

    @property
    def avg_diff(self) -> float:
        return self.diff_total / self.diff_count if self.diff_count else 0.0

    @property
    def avg_raw(self) -> float:
        return self.raw_total / self.raw_count if self.raw_count else 0.0

    def speed_and_fps(self) -> tuple[float, float]:
        now = time.monotonic()
        self._evict(now)
        if not self._recent:
            return 0.0, 0.0
        span = max(self.WINDOW_SECONDS, now - self._recent[0].t)
        speed = sum(f.size for f in self._recent) / span
        fps = len(self._recent) / span
        return speed, fps

    def dart_avg_ms(self) -> float:
        now = time.monotonic()
        self._evict_latency_window(self._dart_latencies, now)
        if not self._dart_latencies:
            return 0.0
        return (
            1000.0
            * sum(lat for _, lat in self._dart_latencies)
            / len(self._dart_latencies)
        )

    def mpl_avg_ms(self) -> float:
        now = time.monotonic()
        self._evict_latency_window(self._mpl_gaps, now)
        if not self._mpl_gaps:
            return 0.0
        return 1000.0 * sum(g for _, g in self._mpl_gaps) / len(self._mpl_gaps)


def _human_bytes(n: float) -> str:
    if n < 1024:
        return f"{n:.0f} B"
    if n < 1024 * 1024:
        return f"{n / 1024:.1f} KB"
    if n < 1024**3:
        return f"{n / (1024 * 1024):.1f} MB"
    return f"{n / (1024**3):.2f} GB"


async def main(page: ft.Page):
    from mpl_toolkits.mplot3d import axes3d

    fig = plt.figure()
    ax = fig.add_subplot(projection="3d")
    X, Y, Z = axes3d.get_test_data(0.1)

    # Plot the 3D surface
    ax.plot_surface(
        X, Y, Z, edgecolor="royalblue", lw=0.5, rstride=8, cstride=8, alpha=0.3
    )

    # Plot projections of the contours for each dimension.  By choosing offsets
    # that match the appropriate axes limits, the projected contours will sit on
    # the 'walls' of the graph
    ax.contourf(X, Y, Z, zdir="z", offset=-100, cmap="coolwarm")
    ax.contourf(X, Y, Z, zdir="x", offset=-40, cmap="coolwarm")
    ax.contourf(X, Y, Z, zdir="y", offset=40, cmap="coolwarm")

    ax.set(
        xlim=(-40, 40),
        ylim=(-40, 40),
        zlim=(-100, 100),
        xlabel="X",
        ylabel="Y",
        zlabel="Z",
    )

    chart = flet_charts.MatplotlibChartWithToolbar(figure=fig, expand=True)

    # Status bar: regular Flet Text controls in a Row at the bottom.
    avg_raw_text = ft.Text("avg raw: —", size=12)
    avg_full_text = ft.Text("avg full: —", size=12)
    avg_diff_text = ft.Text("avg diff: —", size=12)
    total_text = ft.Text("total: —", size=12)
    speed_text = ft.Text("speed: —", size=12)
    fps_text = ft.Text("fps: —", size=12)
    dart_text = ft.Text("dart: —", size=12)
    mpl_text = ft.Text("mpl: —", size=12)

    status_bar = ft.Container(
        content=ft.Row(
            [
                avg_raw_text,
                avg_full_text,
                avg_diff_text,
                total_text,
                speed_text,
                fps_text,
                dart_text,
                mpl_text,
            ],
            spacing=20,
            # Scroll instead of overflowing when the window is narrower
            # than the full set of counters.
            scroll=ft.ScrollMode.HIDDEN,
        ),
        padding=ft.Padding.symmetric(horizontal=12, vertical=6),
        bgcolor=ft.Colors.SURFACE_CONTAINER_HIGH,
    )

    page.add(
        ft.SafeArea(
            content=ft.Column(
                [chart, status_bar],
                expand=True,
                spacing=0,
            ),
            expand=True,
        )
    )

    stats = FrameStats()

    # Instrument the canvas to capture per-frame sizes + latency. Both
    # `chart.mpl` and `chart.mpl.mpl_canvas` are populated by their
    # respective `build()` calls, which run only after the control is
    # mounted — hence this wrapping has to happen after `page.add(...)`.
    canvas = chart.mpl.mpl_canvas
    orig_full = canvas.apply_full
    orig_diff = canvas.apply_diff
    orig_raw = canvas.apply_raw_packet

    async def apply_full(image_bytes: bytes) -> None:
        stats.record_send(len(image_bytes), kind="full")
        await orig_full(image_bytes)

    async def apply_diff(image_bytes: bytes) -> None:
        stats.record_send(len(image_bytes), kind="diff")
        await orig_diff(image_bytes)

    async def apply_raw_packet(packet: bytes) -> None:
        stats.record_send(len(packet), kind="raw")
        await orig_raw(packet)

    canvas.apply_full = apply_full
    canvas.apply_diff = apply_diff
    canvas.apply_raw_packet = apply_raw_packet

    # Register an observer for frame-applied acks so we can record the
    # Dart-side timing. Pure observation — backpressure is handled by
    # the apply_*/await pattern in `MatplotlibChart._receive_loop`.
    canvas.set_on_frame_applied(stats.record_ack)

    # Background task: refresh the labels at ~4 Hz so speed/fps decay
    # visibly when traffic stops and stay readable during fast drags
    # (vs. updating once per frame, which thrashes the layout).
    async def refresh_loop() -> None:
        while True:
            speed, fps = stats.speed_and_fps()
            avg_raw_text.value = (
                f"avg raw: {_human_bytes(stats.avg_raw)} (n={stats.raw_count})"
            )
            avg_full_text.value = (
                f"avg full: {_human_bytes(stats.avg_full)} (n={stats.full_count})"
            )
            avg_diff_text.value = (
                f"avg diff: {_human_bytes(stats.avg_diff)} (n={stats.diff_count})"
            )
            total_text.value = f"total: {_human_bytes(stats.bytes_total)}"
            speed_text.value = f"speed: {_human_bytes(speed)}/s"
            fps_text.value = f"fps: {fps:.1f}"
            dart_text.value = f"dart: {stats.dart_avg_ms():.1f} ms"
            mpl_text.value = f"mpl: {stats.mpl_avg_ms():.1f} ms"
            try:
                page.update()
            except RuntimeError:
                # Window closed — session destroyed; stop refreshing.
                return
            await asyncio.sleep(0.25)

    asyncio.create_task(refresh_loop())


if __name__ == "__main__":
    ft.run(main)
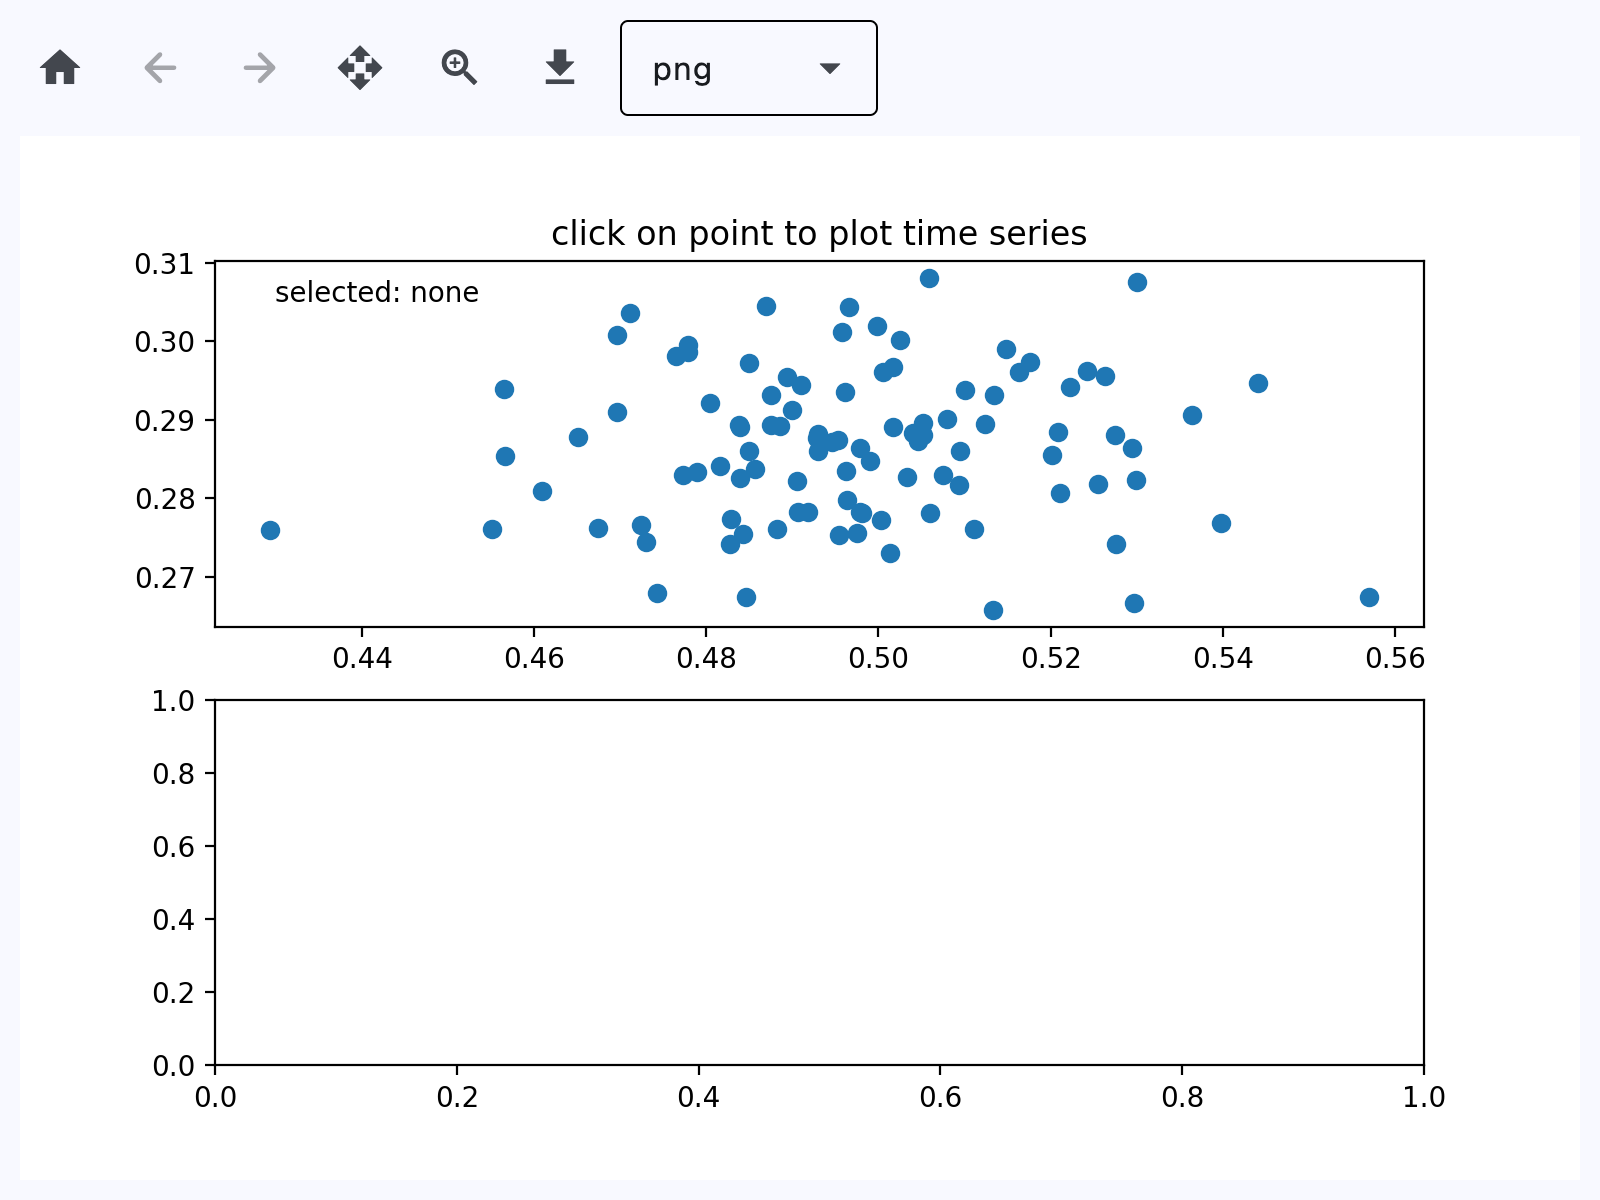
Handle Events
play_arrowTry Online
import matplotlib.pyplot as plt
import numpy as np

import flet as ft
import flet_charts as fch

state = {}


def main(page: ft.Page):
    # Fixing random state for reproducibility
    np.random.seed(19680801)

    X = np.random.rand(100, 200)
    xs = np.mean(X, axis=1)
    ys = np.std(X, axis=1)

    fig, (ax, ax2) = plt.subplots(2, 1)
    ax.set_title("click on point to plot time series")
    (line,) = ax.plot(xs, ys, "o", picker=True, pickradius=5)

    class PointBrowser:
        """
        Click on a point to select and highlight it -- the data that
        generated the point will be shown in the lower Axes.  Use the 'n'
        and 'p' keys to browse through the next and previous points
        """

        def __init__(self):
            self.lastind = 0

            self.text = ax.text(
                0.05, 0.95, "selected: none", transform=ax.transAxes, va="top"
            )
            (self.selected,) = ax.plot(
                [xs[0]], [ys[0]], "o", ms=12, alpha=0.4, color="yellow", visible=False
            )

        def on_press(self, event):
            if self.lastind is None:
                return
            if event.key not in ("n", "p"):
                return
            inc = 1 if event.key == "n" else -1

            self.lastind += inc
            self.lastind = np.clip(self.lastind, 0, len(xs) - 1)
            self.update()

        def on_pick(self, event):
            if event.artist != line:
                return True

            N = len(event.ind)
            if not N:
                return True

            # the click locations
            x = event.mouseevent.xdata
            y = event.mouseevent.ydata

            distances = np.hypot(x - xs[event.ind], y - ys[event.ind])
            indmin = distances.argmin()
            dataind = event.ind[indmin]

            self.lastind = dataind
            self.update()

        def update(self):
            if self.lastind is None:
                return

            dataind = self.lastind

            ax2.clear()
            ax2.plot(X[dataind])

            ax2.text(
                0.05,
                0.9,
                f"mu={xs[dataind]:1.3f}\nsigma={ys[dataind]:1.3f}",
                transform=ax2.transAxes,
                va="top",
            )
            ax2.set_ylim(-0.5, 1.5)
            self.selected.set_visible(True)
            self.selected.set_data([xs[dataind]], [ys[dataind]])

            self.text.set_text(f"selected: {dataind:d}")
            fig.canvas.draw()

    browser = PointBrowser()
    state["browser"] = browser

    fig.canvas.mpl_connect("pick_event", browser.on_pick)
    fig.canvas.mpl_connect("key_press_event", browser.on_press)

    # plt.show()

    page.add(
        ft.SafeArea(
            expand=True,
            content=fch.MatplotlibChartWithToolbar(figure=fig, expand=True),
        )
    )


if __name__ == "__main__":
    ft.run(main)
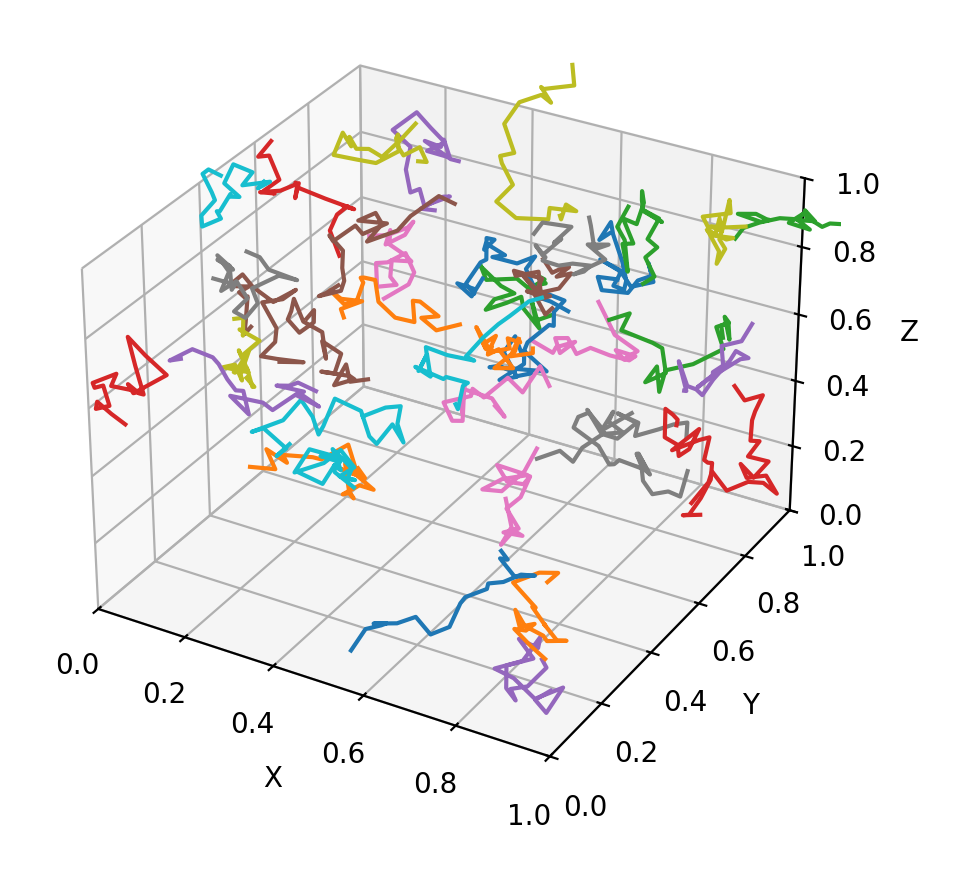
Animate
play_arrowTry Online
import logging

import matplotlib.pyplot as plt
import numpy as np

import flet as ft
import flet_charts

logging.basicConfig(level=logging.INFO)

state = {}


def main(page: ft.Page):
    import matplotlib.animation as animation

    # Fixing random state for reproducibility
    np.random.seed(19680801)

    def random_walk(num_steps, max_step=0.05):
        """Return a 3D random walk as (num_steps, 3) array."""
        start_pos = np.random.random(3)
        steps = np.random.uniform(-max_step, max_step, size=(num_steps, 3))
        walk = start_pos + np.cumsum(steps, axis=0)
        return walk

    def update_lines(num, walks, lines):
        for line, walk in zip(lines, walks):
            line.set_data_3d(walk[:num, :].T)
        return lines

    # Data: 40 random walks as (num_steps, 3) arrays
    num_steps = 30
    walks = [random_walk(num_steps) for index in range(40)]

    # Attaching 3D axis to the figure
    fig = plt.figure()
    ax = fig.add_subplot(projection="3d")

    # Create lines initially without data
    lines = [ax.plot([], [], [])[0] for _ in walks]

    # Setting the Axes properties
    ax.set(xlim3d=(0, 1), xlabel="X")
    ax.set(ylim3d=(0, 1), ylabel="Y")
    ax.set(zlim3d=(0, 1), zlabel="Z")

    # Creating the Animation object
    state["anim"] = animation.FuncAnimation(
        fig, update_lines, num_steps, fargs=(walks, lines), interval=100
    )

    page.add(
        ft.SafeArea(
            expand=True,
            content=flet_charts.MatplotlibChartWithToolbar(figure=fig, expand=True),
        )
    )


if __name__ == "__main__":
    ft.run(main)
Properties
figureclass-attributeinstance-attribute
figure: Figure = field(metadata={'skip': True})Matplotlib figure to draw - an instance of
matplotlib.figure.Figure.
Methods
build
build()download_clickasync
download_click()Export the figure in the selected format and prompt user to save it.
on_message
on_message(e: flet_charts.MatplotlibChartMessageEvent)Show status text produced by the underlying chart toolbar backend.
Parameters:
- e (flet_charts.MatplotlibChartMessageEvent) - Message event emitted by
MatplotlibChart.
on_toolbar_update
on_toolbar_update(
    e: flet_charts.MatplotlibChartToolbarButtonsUpdateEvent,
)
Synchronize back/forward button enabled state with chart history.
Parameters:
- e (flet_charts.MatplotlibChartToolbarButtonsUpdateEvent) - Toolbar state update event from
MatplotlibChart.