BarChart
Draws a bar chart.
Examples
BarChart 1
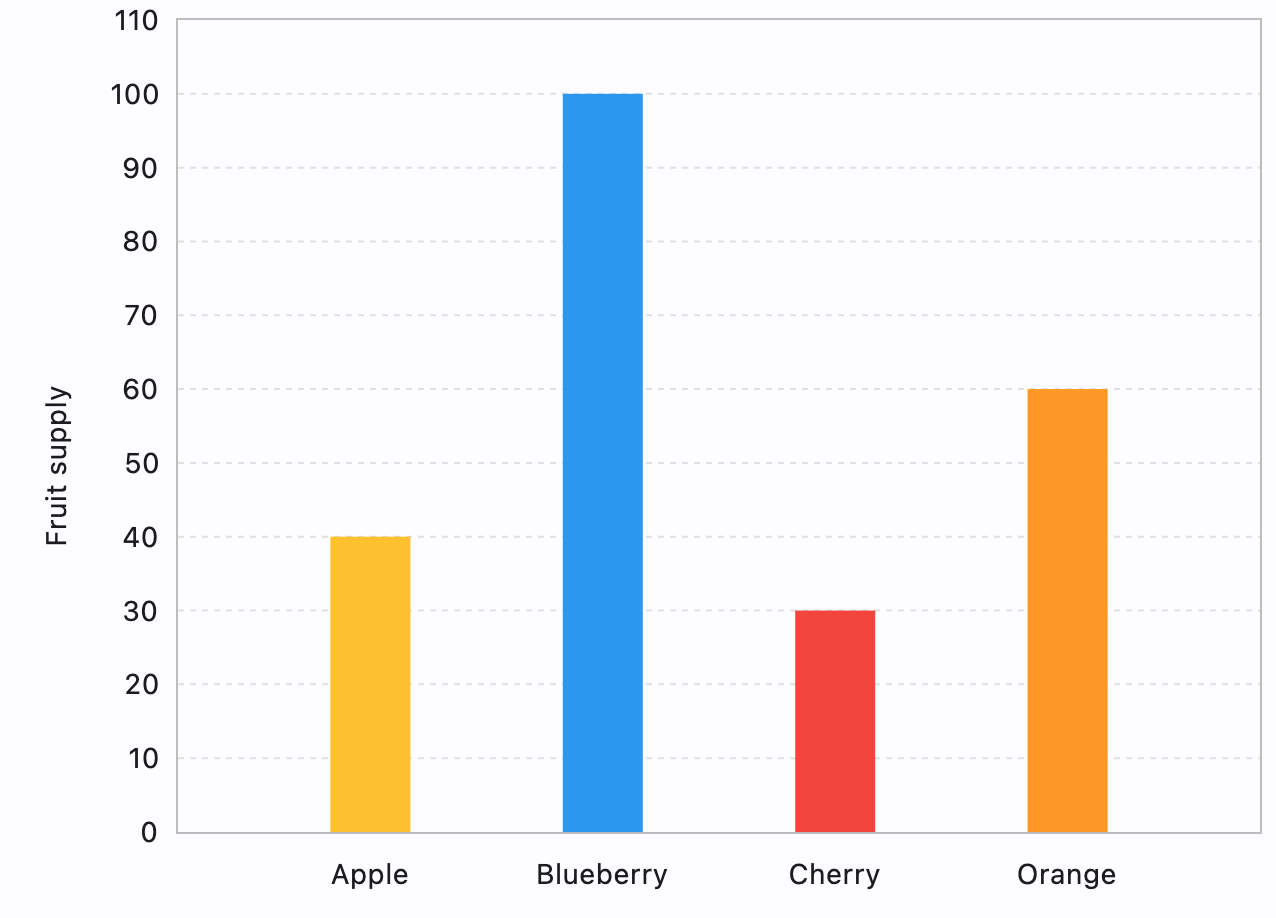
loading...
BarChart 2
loading...
BarChart properties

animate
Controls chart implicit animation.
Value is of AnimationValue type.
bar_groups
The list of BarChartGroup to draw.
baseline_y
Baseline value for Y axis.
Defaults to 0.
bgcolor
Background color of the chart.
border
The border around the chart.
Value is of type Border.
bottom_axis
Configures the appearance of the bottom axis, its title and labels. The value is the instance
of ChartAxis class.
groups_space
A gap between bar groups.
horizontal_grid_lines
Controls drawing of chart's horizontal lines.
Value is of type ChartGridLines.
interactive
Enables automatic tooltips when hovering chart bars.
left_axis
Configures the appearance of the left axis, its title and labels.
Value is of type ChartAxis.
max_y
Configures the maximum displayed value for Y axis.
min_y
Configures the minimum displayed value for Y axis.
right_axis
Configures the appearance of the right axis, its title and labels. The value is the instance
of ChartAxis class.
top_axis
Configures the appearance of the top axis, its title and labels. The value is the instance
of ChartAxis class.
tooltip_bgcolor
Background color of tooltips.
tooltip_border_side
The tooltip border side.
tooltip_direction
Controls showing tooltip on top or bottom, default is auto.
tooltip_fit_inside_horizontally
Forces the tooltip to shift horizontally inside the chart, if overflow happens.
Value is of type bool.
tooltip_fit_inside_vertically
Forces the tooltip to shift vertically inside the chart, if overflow happens.
Value is of type bool.
tooltip_horizontal_offset
Applies horizontal offset for showing tooltip.
Defaults to 0.
tooltip_margin
Applies a bottom margin for showing tooltip on top of rods.
tooltip_max_content_width
Restricts the tooltip's width.
tooltip_padding
Applies a padding for showing contents inside the tooltip.
tooltip_rounded_radius
Sets a rounded radius for the tooltip.
tooltip_rotate_angle
The rotation angle of the tooltip.
vertical_grid_lines
Controls drawing of chart's vertical lines.
Value is of type ChartGridLines.
BarChart events
on_chart_event
Fires when a bar is hovered or clicked.
Event handler receives an instance of BarChartEvent.