Happy New Year! Flet project has reached ⭐️ 3.3K stars ⭐️ on GitHub which is very exciting and encouraging! Thank you all for your support!
We are starting this year with the release of Flet 0.3.2 bringing a long-awaited feature: creating standalone desktop bundles with a custom icon!
flet command has been used for running Flet program with hot reload, but we recently re-worked Flet CLI to support multiple actions.
There is a new flet pack command that wraps PyInstaller API to package your Flet Python app into a standalone Windows executable or macOS app bundle which can be run by a user with no Python installed.
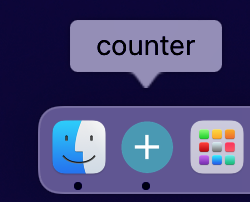
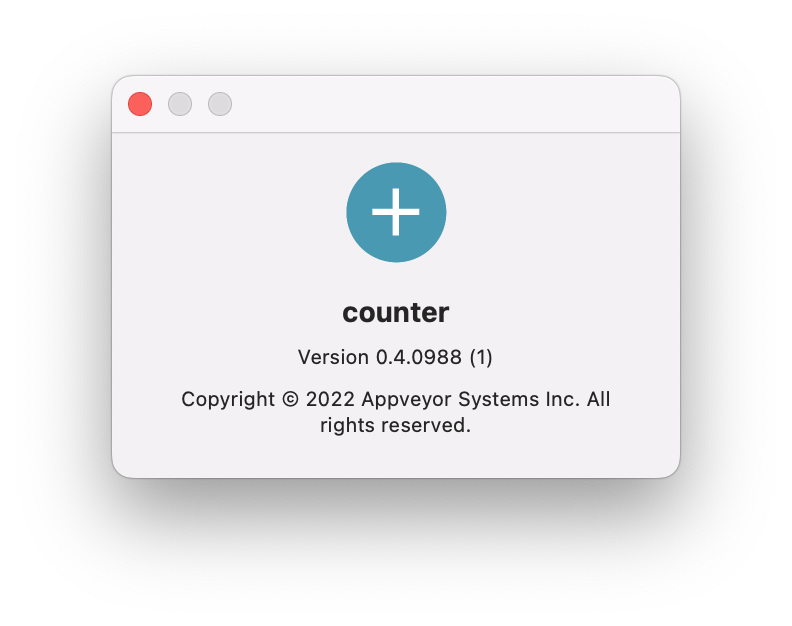
Command's --icon argument is now changing not only executable's icon, but Flet's app window icon and the icon shown in macOS dock, Windows taskbar, macOS "About" dialog, Task Manager and Activity Monitor:

Bundle name, version and copyright can be changed too:

Find all available options for packaging desktop apps in the updated guide.
Upgrade Flet module to the latest version (pip install flet --upgrade), give flet pack command a try and let us know what you think!


